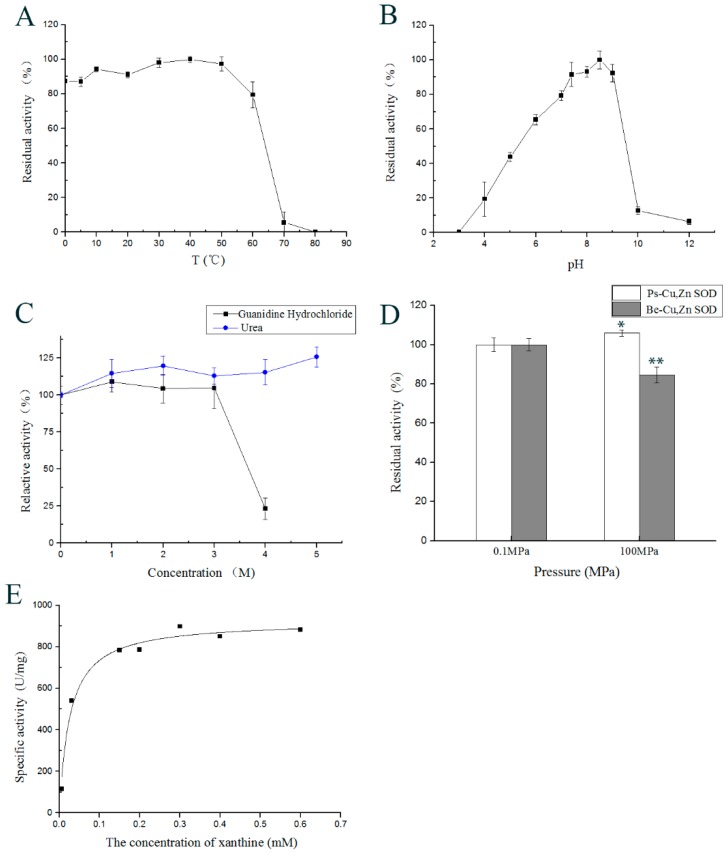
Figure 6.
(A). Effect of temperature ranging from 0–80 °C on the enzyme activity. Each square in the graph represents the mean ± SD (n = 3). (B) Effect of pH on the enzyme activity. Tests were performed using different pH buffers ranging from 3.0–12.0 °C at 25 °C for 1 h. Each square in the graph represents the mean ± SD (n = 3). (C) Effects of denaturants on SOD activity. Values are mean ± SD of three separate replicates. The residual enzyme activity of the sample without denaturant was defined as 100%. (D) Effects of high hydrostatic pressure on SOD activity. Enzyme activity at 0.1 MPa at 5 °C was considered as 100%. Data are shown as mean values (n = 3) ± SD. (E) Michaelis-Menten equation of recombinant Ps-Cu,Zn-SOD. * p < 0.05; ** p < 0.01.

