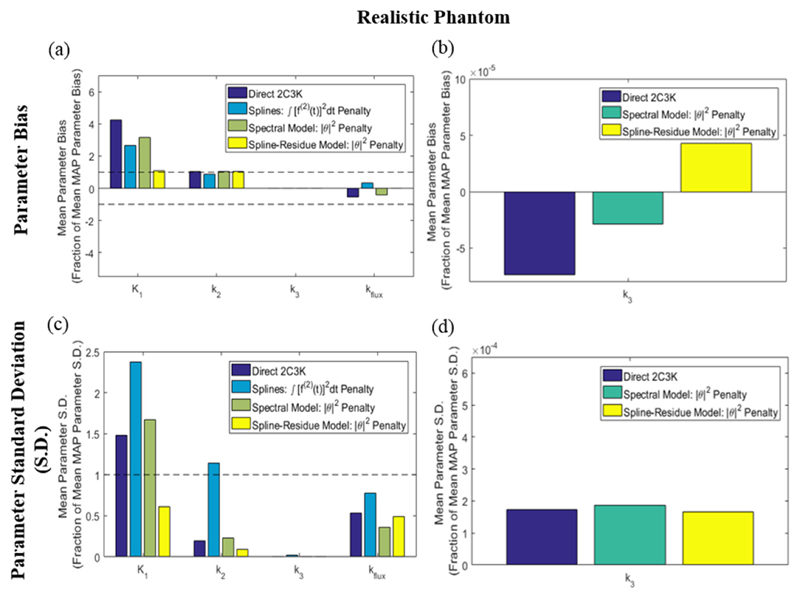
Figure 10.
(a) Bias and (c) noise (standard deviation) of fitted parameter values in parametric maps derived from the 4D-PET reconstructed images of the realistic phantom, averaged over the entire parametric map of the image sub-region shown in figure 3(b). Values are plotted for each of the kinetic parameters as fractions of those obtained for the same parameter from analysis of conventional (non-4D) MAP-reconstructed images. Results for the k3 parametric maps obtained from the 2C3K, spectral and spline-residue model based 4D reconstructions are re-plotted on larger scales in (b) and (d) to make them visible.

