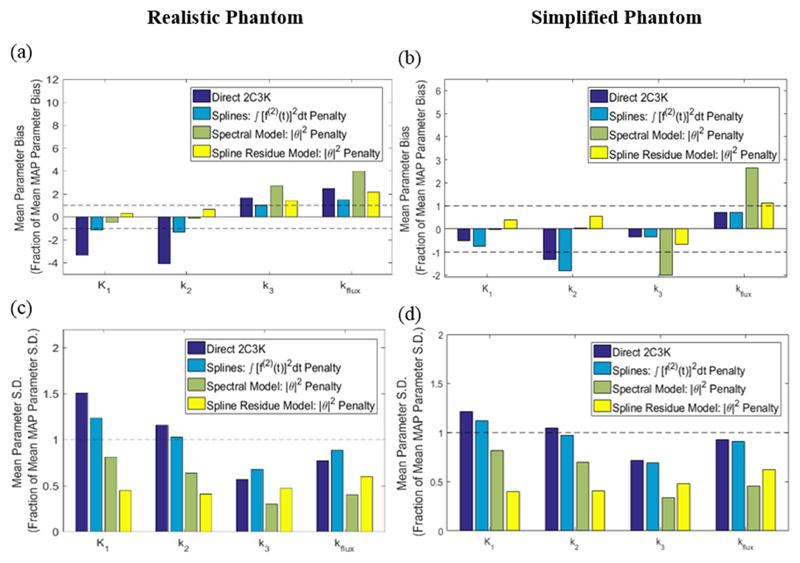
Figure 12.
(a) and (b) Bias and (c) and (d) noise (standard deviation) of fitted parameter values in parametric maps derived from the 4D-PET reconstructed images of the realistic phantom, averaged over the hypoxic tumour region alone. For each of the kinetic parameters, the values plotted are fractions of those obtained for the same parameters from analysis of conventional (non-4D) MAP-reconstructed images.

