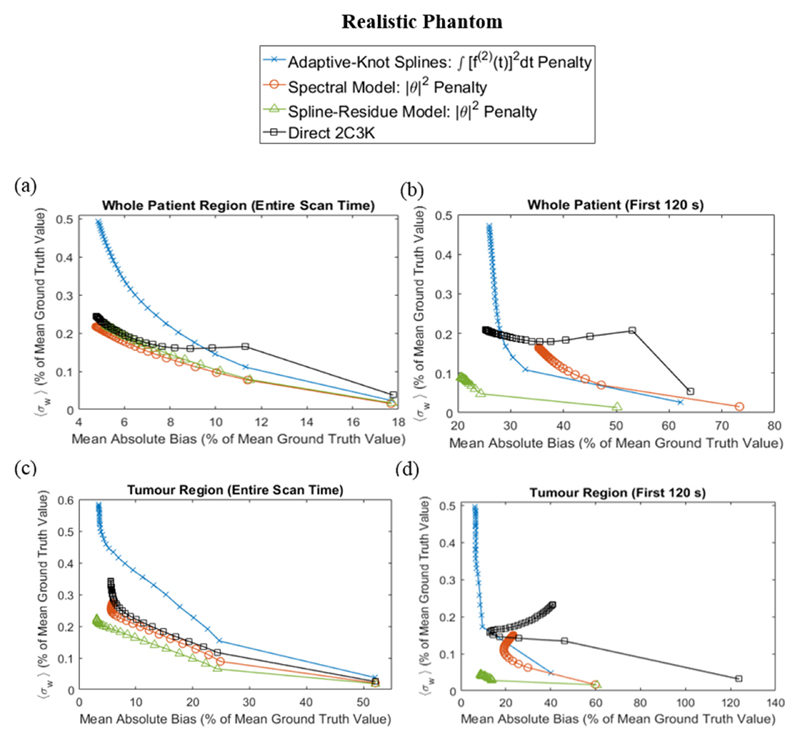
Figure 6.
Comparison of image quality metrics for 4D reconstructions of the realistic phantom based on linear models (with their optimal temporal roughness penalty) and on the 2C3K model. The noise and bias metrics are averaged over the whole patient (a) and (b) and tumour (c) and (d) phantom regions, and over the entire scan time (a) and (c) and first 120 s (b) and (d).

