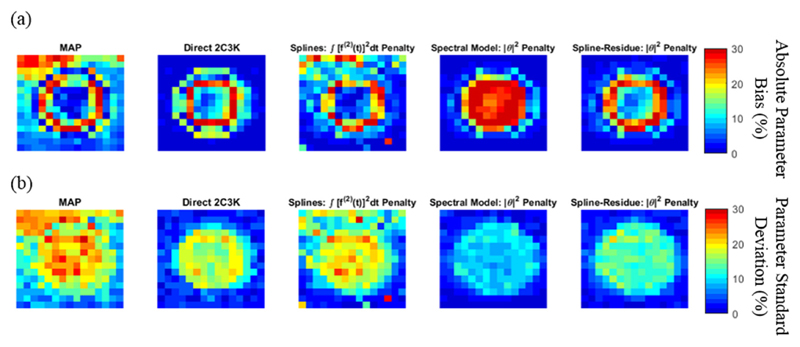
Figure 9.
Voxel-by-voxel plots of (a) the absolute bias and (b) the noise (standard deviation) in the kflux parametric maps of the sub-region of the realistic phantom obtained from image sequences reconstructed using the conventional (non-4D) MAP algorithm, as well as using the 2C3K and linear model-based nested-MAP reconstructions (with their optimal temporal roughness penalties). Bias and standard deviation values are expressed as percentages of the average ground-truth kflux value across the phantom sub-region.

