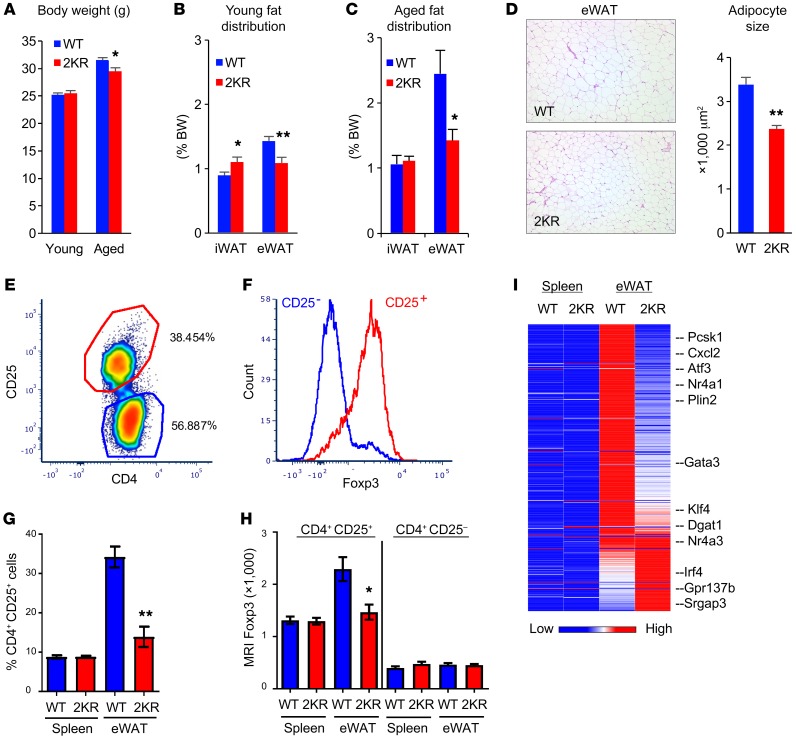
Figure 3. Protection against visceral obesity in 2KR mice.
(A) BW of chow-fed young (3 months old) and aged (12 to 13 months old) male mice. *P < 0.05. n = 8 WT (young); n = 8 2KR (young); n = 9 WT (aged); n = 9 2KR (aged). (B and C) WAT fat pad sizes in young (B) or aged (C) male mice sacrificed at ad libitum feeding. *P < 0.05; **P < 0.01. n = 8 WT (young); n = 8 2KR (young); n = 9 WT (aged); n = 9 2KR (aged). (D) Representative H&E staining of visceral epididymal fat (eWAT) and quantification of adipocyte size in aged male mice. Original magnification, ×100. (E) Isolation of Tregs (CD4+CD25+) from eWAT of aged male WT mice. (F) Confirmation of the presence of fat Treg marker Foxp3 in isolated T cells. (G) Proportion of Treg (CD25+) cells among spleen and eWAT CD4+ T cells. **P < 0.001. n = 5 WT; n = 5 2KR. This experiment was repeated twice. (H) Mean fluorescence intensity (MFI) of Foxp3 in isolated T cells. *P < 0.05. n = 5 WT; n = 5 2KR. (I) Fat Treg signature gene expression profiling by RNA-seq. Spleen Tregs were used as control. Data represent mean ± SEM. Student’s t test was used for statistical analyses.

