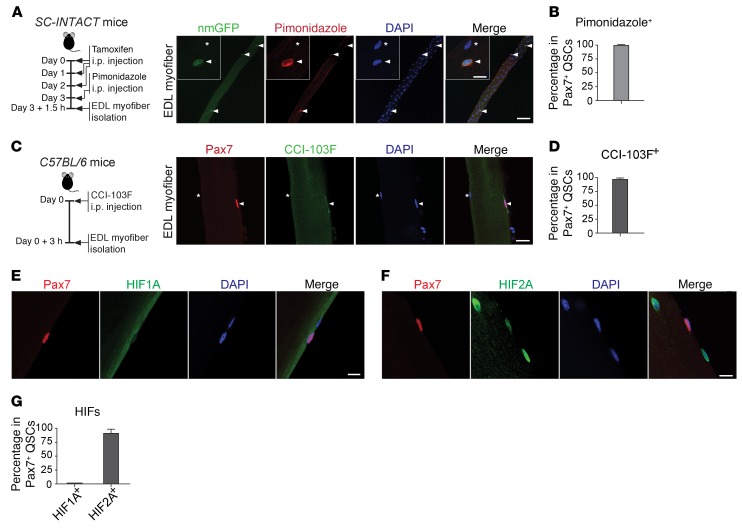
Figure 1. QSCs are hypoxic in the niche and express HIF2A, but not HIF1A.
(A) Timeline of in vivo pimonidazole labeling in SC-INTACT mice and representative confocal images of uninjured/resting EDL myofibers (n >50 myofibers from n = 3 mice) showing that nmGFP+ QSCs were pimonidazole+. Scale bars: 50 μm and 10 μm (insets). Inset images show that pimonidazole signals were relatively enriched in the cytoplasm of QSCs. Arrowheads indicate a QSC; asterisks indicate a myonucleus. (B) Percentage of pimonidazole+ QSCs. (C) Timeline of in vivo CCI-103F labeling in C57BL/6 mice and representative images of uninjured/resting EDL myofibers (n >50 myofibers from 3 mice) showing that nmGFP+ QSCs were CCI-103F+. Arrowheads indicate a QSC; asterisks indicate a myonucleus. Scale bar: 20 μm. (D) Percentage of CCI-103F+ QSCs. (E and F) Representative images of uninjured/resting EDL myofibers from C57BL/6 mice (n >50 myofibers from 6 mice/group) showing that most QSCs were HIF2A+, but HIF1A–. Scale bars: 10 μm. (G) Percentage of HIF1A+ and HIF2A+ QSCs. Data represent the mean ± SEM.

