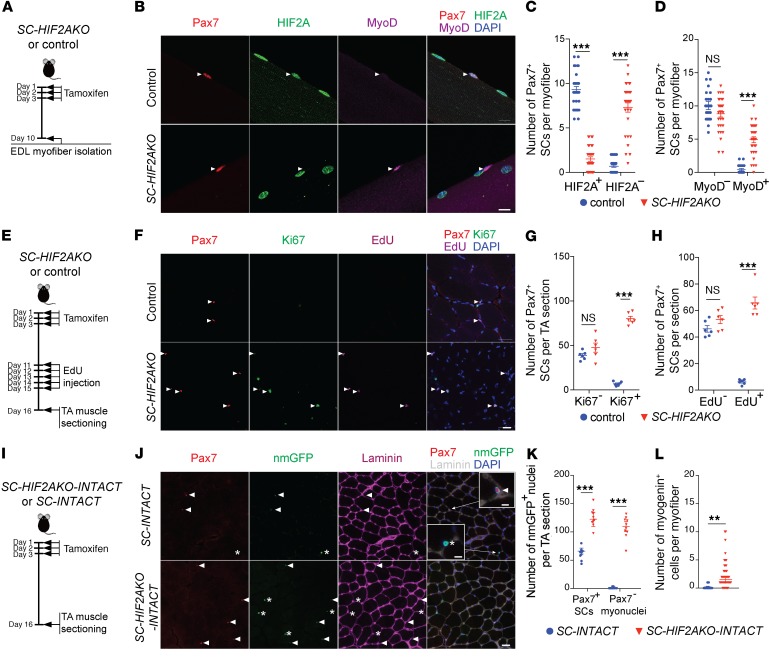
Figure 3. Genetic ablation of HIF2A in QSCs leads to transient activation, proliferation, and differentiation of SCs.
(A) Timeline of genetic ablation of HIF2A in QSCs. (B) Representative images of myofibers from SC-HIF2AKO mice and control littermates (n >50 myofibers from 5 mice/group; 10 dpr). Immunofluorescence of Pax7 (red), HIF2A (green), MyoD (purple), and DAPI (blue) staining revealed HIF2A–MyoD+ and HIF2A+MyoD– SCs (arrowheads) in SC-HIF2AKO and control mice, respectively. Scale bar: 10 μm. (C) Number of HIF2A+ and HIF2A– SCs per myofiber (10 dpr). (D) Number of MyoD– and MyoD+ SCs per myofiber (10 dpr). (E) Timeline characterizing SC proliferation after HIF2A ablation in QSCs. (F) Representative cross-sectional images of TA muscles from SC-HIF2AKO mice and control littermates (n = 6 mice/group; 16 dpr). Immunofluorescence of Pax7 (red), Ki67 (green), EdU (purple), and DAPI (blue) staining revealed an increase in Ki67+EdU+ SCs (arrowheads) in SC-HIF2AKO mice. Scale bar: 20 μm. (G) Number of Ki67– and Ki67+ SCs per TA section. (H) Number of EdU– and EdU+ SCs per TA section. (I) Timeline for tracing SC fates after HIF2A ablation in QSCs. (J) Representative images of TA muscles from SC-HIF2AKO-INTACT and control SC-INTACT mice (n = 6 mice/group; 16 dpr). Immunofluorescence of nmGFP, Pax7, laminin B2, and DAPI revealed increased nmGFP+Pax7+ SCs (arrowheads) and nmGFP+Pax7– myonuclei (asterisks) in SC-HIF2AKO-INTACT mice. Scale bar: 20 μm and 5 μm (insets). Inset images show that both nmGFP+Pax7+ SCs and nmGFP+Pax7– myonuclei are adjacent to the basal lamina. (K) Number of nmGFP+Pax7+ SCs and nmGFP+Pax7– myonuclei per TA section. (L) Number of nmGFP+myogenin+ differentiating SCs per EDL myofiber (16 dpr). **P < 0.01 and ***P < 0.005, by 2-sided Student’s t test. Data represent the mean ± SEM.

