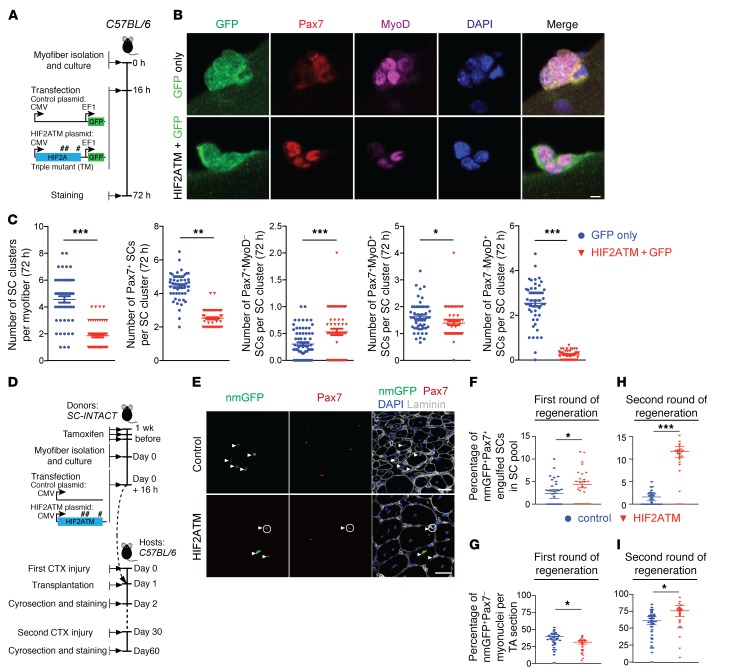
Figure 5. HIF2A stabilization under normoxia promotes quiescence, self-renewal, and stemness of SCs yet impedes myogenic differentiation.
(A) Diagram depicting the timeline and plasmids used for HIF2A stabilization in normoxic SC culture. Pound signs denote the number and locations of point mutations in HIF2ATM. (B) Representative images of transfected (GFP+) SC clusters on myofibers from C57BL/6 mice (n >50 myofibers from 7 mice/group). The SC clusters were transfected with either HIF2ATM or control plasmids and stained for Pax7, MyoD, and DAPI. Scale bar: 5 μm. (C) Number of SC clusters, Pax7+ SCs per SC cluster, and Pax7+MyoD–, Pax7+MyoD+, and Pax7–MyoD+ SCs per SC cluster (n >50 myofibers). (D) Diagram of the experimental scheme for transplantation of HIF2A-stabilized SCs and tracing of their cell fates in vivo. (E) Cross-sectional images of TA muscles that were transplanted with HIF2ATM- or control plasmid–transfected SCs (n = 5 mice/group; 21 days after the first injury). Immunofluorescence of Pax7 and nmGFP revealed 2 fates of transplanted SCs: engrafted SCs that retained stemness (nmGFP+Pax7+; circles, bottom) and engrafted SCs that differentiated into myonuclei (nmGFP+Pax7–; arrowheads). Scale bars: 20 μm. (F and H) Percentage of engrafted and self-renewed nmGFP+Pax7+ SCs in the total SC pool after the first round (21 dpi; n = 5 mice/group in F) and second round (30 dpi; n = 6 mice/group in H) of regeneration. (G and I) Number of nmGFP+Pax7– differentiated myonuclei per TA muscle section after the first round (G) and second round (I) of regeneration. *P < 0.05, **P < 0.01, and ***P < 0.005, by 2-sided Student’s t test. Data represent the mean ± SEM.

