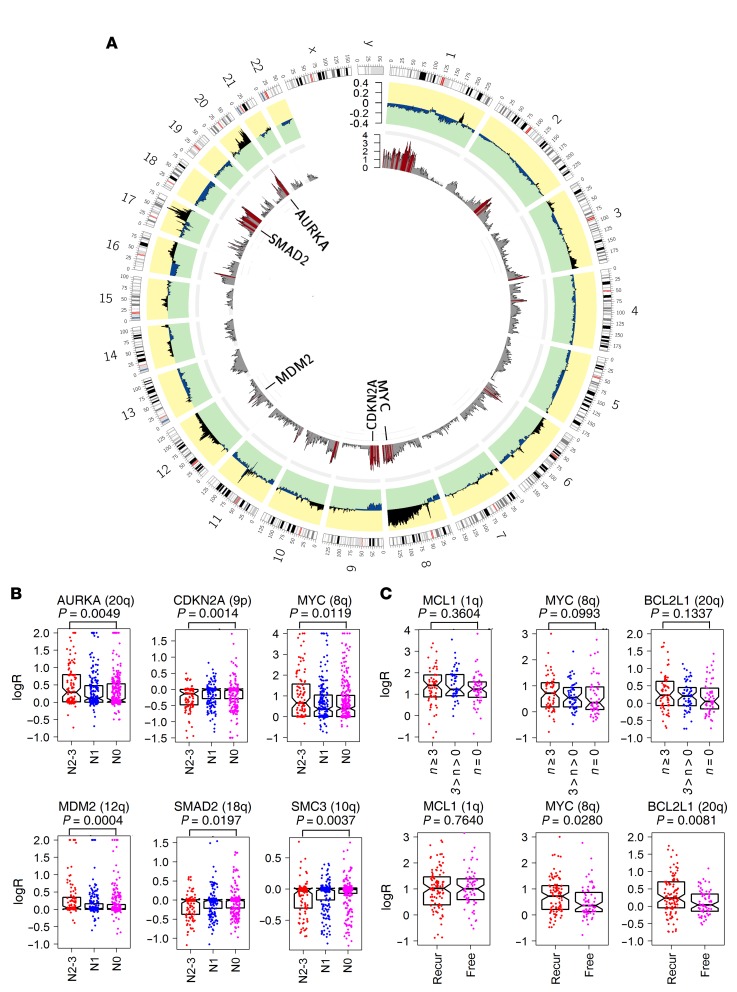
Figure 6. Genome regions associated with lymph node metastasis in breast cancers identified by whole-genome association analysis of detailed copy ratios.
(A) Differences in the average logR (outer circle) across the whole genome between primary ER+ breast cancers of patients with N0 (265 samples) and N2–N3 (106 samples) lymph node metastasis status (data from TCGA). P value of each gene (inner circle) was calculated for the logRs between the 2 groups (Wilcoxon’s rank sum test); red bars denote genes with P < 0.02. (B) Comparison of copy ratios of AURKA (chr20q), CDKN2A (chr9p), MYC (chr8q), MDM2 (chr12q), SMAD2 (chr18q), and SMC3 (chr10q) in the TCGA ER+ breast cancers grouped according to patient lymph node status (N0, N1, and N2–N3,). Significance of difference between N0 and N2–N3 groups was tested by Wilcoxon’s rank sum test. Each point represents the copy ratio of 1 sample. (C) Comparison of copy ratios of MCL1, MYC, and BCL2L1 in 170 Danish primary ER+ breast cancers grouped according to the number of positive lymph nodes of the patient (of n = 0, 0 < n < 3, and n ≥ 3) and recurrence status (recurrence [Recur] vs. without recurrence [Free]). Significance of difference between n = 0 and n ≥ 3 groups and between recurrence and without recurrence groups was tested by Wilcoxon’s rank sum test. Each point represents the copy ratio of 1 sample. Error bars in B and C represent the values of median and upper and lower quartiles.

