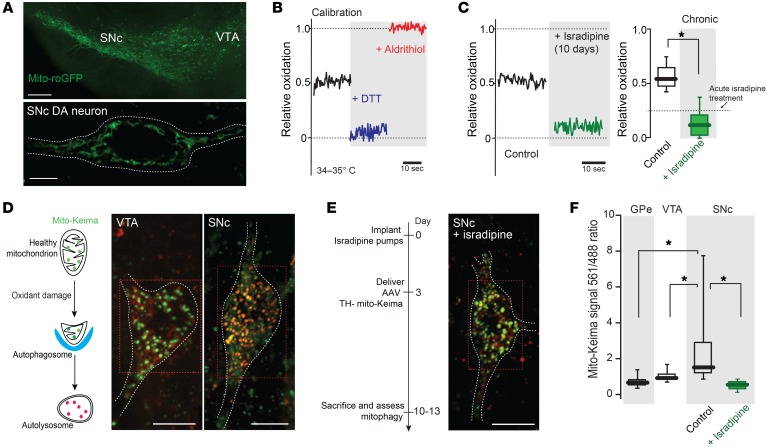
Figure 5. Chronic isradipine treatment decreased mitochondrial oxidant stress and mitochondrial turnover, resulting in increased mitochondrial density.
(A) Top: low-magnification image of a midbrain slice from transgenic TH-mito-roGFP mouse showing fluorescence in SNc and VTA. Bottom: higher-magnification image of a SNc DA neuron showing mitochondrial labeling, with a white dashed line at cell membrane. (B) Mito-roGFP measurements from a SNc DA neuron before (control, black trace) and after application of dithiothreitol (DTT, blue trace) and aldrithiol (red trace). (C) Left: Mito-roGFP measurements in SNc DA neuron after chronic systemic administration of isradipine showing diminished mitochondrial oxidation. Right: box plots summarizing median redox measurements in control (7 neurons from 4 mice) and isradipine-treated mice (8 neurons from 4 mice). Dashed line indicates published data (14). (D) Left: drawing showing the pH-dependent fluorescent properties of mito-Keima, which allowed rapid determination as to whether the protein was in the mitochondria (pH 8.0) or the lysosome (pH 4.5). Mito-Keima fluorescence signal from 488 nm laser excitation (neutral pH) is shown in green and the signal from 561 nm laser excitation (acidic) is shown in red. Note the difference in mito-Keima fluorescence between VTA and SNc DA neuron. (E) Left: schematic presentation of chronic isradipine treatment and mito-Keima experiments. Right: chronic isradipine treatment changed the ratio of mito-Keima in SNc DA neurons compared with control. (F) Box plots summarizing the rate of mitophagy in GPe (10 neurons from 4 mice), VTA DA neurons (15 neurons from 6 mice), and control (21 neurons from 8 mice) and isradipine-treated SNc DA neurons (40 neurons from 7 mice). Note that isradipine significantly decreased the rate of mitophagy in SNc DA neurons. Data were analyzed using 1-tailed Mann-Whitney U test with Dunn’s correction for multiple comparisons. *P < 0.05. Scale bars: 10 μm (A, top); 5 μm (A, bottom); 10 μm (D, E).

