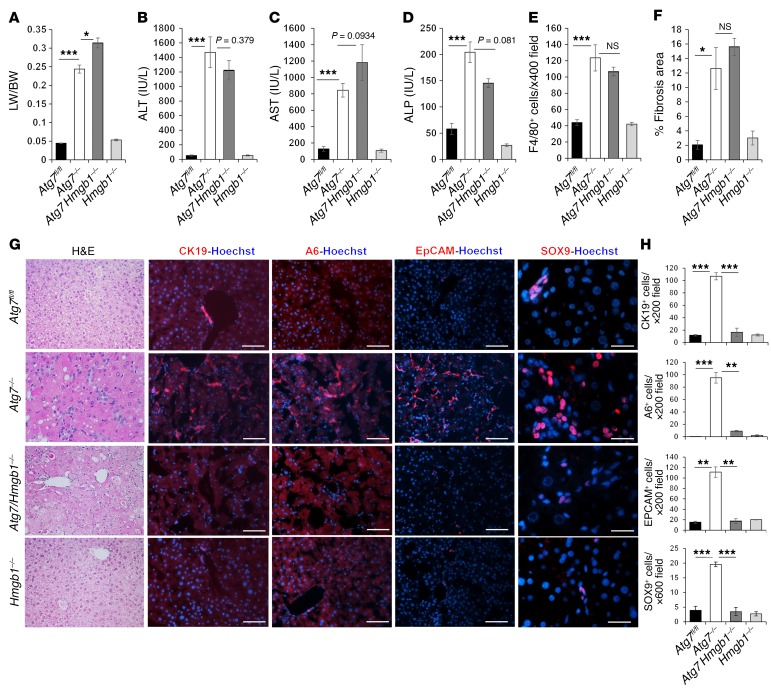
Figure 2. HMGB1 promotes DR in autophagy-deficient livers.
(A–F) Mice were analyzed for liver weight (LW) versus body weight (BW) (A), for levels of serum ALT (B), AST (C), and ALP (D), the number of Kupffer cells (E), and the fibrotic area (F) (n = 4–7 mice/group). (G and H) Liver sections were subjected to H&E staining (original magnification, ×200) and immunostaining. DCs/HPCs were quantified (n = 3 mice/group). Scale bars: 50 μm (CK19, A6, and EPCAM) and 10 μm (SOX9). Data represent the mean ± SEM. *P < 0.05, **P < 0.01, and ***P < 0.001, by 1-way ANOVA with Duncan’s post hoc analysis.

