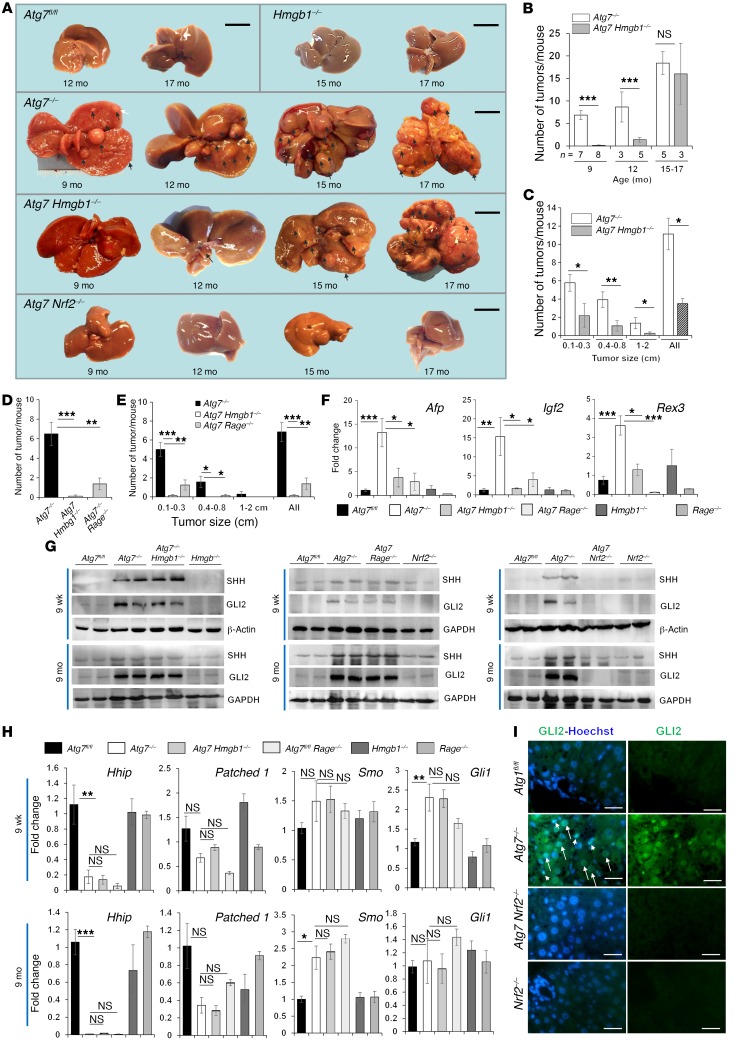
Figure 5. HMGB1 and RAGE promote tumorigenesis in autophagy-deficient livers.
(A) Gross observation of tumors (arrows) from 9- to 17-month-old mice. (B) Average number of tumors (by gross observation) in the livers of Atg7–/– and Atg7 Hmgb1–/– mice. (C) Average size distribution of the tumors observed in Atg7–/– (n = 12) and Atg7 Hmgb1–/– (n = 16) livers, with all age groups combined. (D and E) Average number and size distribution of tumors (by gross observation) in livers from 9-month-old mice (n = 7–8 mice/group). (F) qRT-PCR analysis of hepatic expression of Afp, Igf2, and Rex3 in 9-month-old mice (n = 3–6 mice/group). (G) Immunoblot analysis of hepatic lysates from mice of the indicated ages. (H) Hepatic mRNA levels of Hedgehog signaling components in mice (n = 3 mice/group). (I) GLI2 staining of hepatic sections from 9-week-old mice. Arrows indicate GLI2 staining in hepatocytes, and arrowheads indicate GLI2 staining in nonparenchymal cells. Scale bars: 1 cm (A) and 10 μm (I).Data represent the mean ± SEM. *P < 0.05, **P < 0.01, and ***P < 0.001, by 1-way ANOVA with Duncan’s post hoc analysis (D–F and H) and by 2-sided Student’s t test (B and C).

