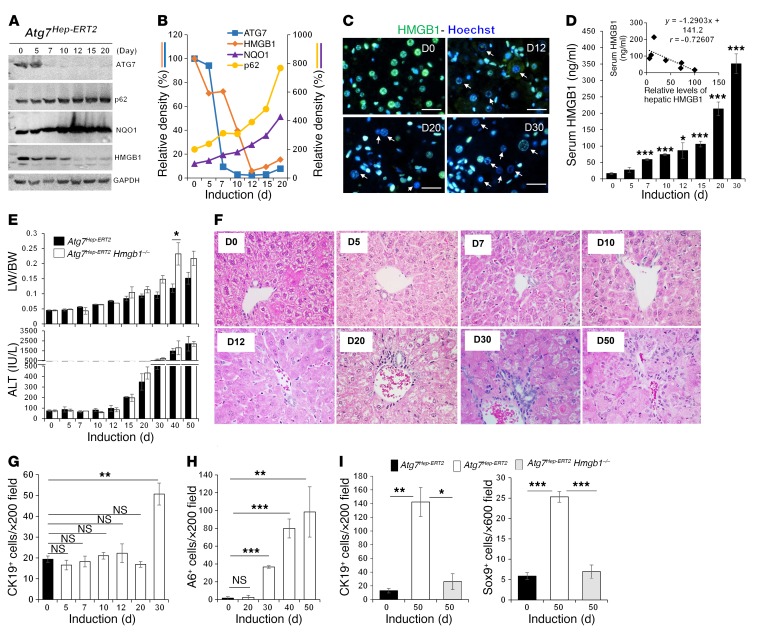
Figure 6. HMGB1 release is an early event following loss of autophagy function.
(A) Atg7Hep-ERT2 mice were given tamoxifen on days 1 and 2. Livers were removed at different time points (days 5–20) and analyzed by immunoblot assay. Mice in the day 0 group received the vehicle control. (B) Densitometric levels of ATG7, HMGB1, NQO1, and p62 were normalized to GAPDH levels and to the day 0 control group. (C) Liver sections from Atg7Hep-ERT2 mice at different time points after induction were stained for HMGB1. Arrows indicate HMGB1-negative nuclei in hepatocytes. Scale bars: 10 μm. (D) Serum HMGB1 levels were determined in Atg7Hep-ERT2 mice from day 0 to day 30 after tamoxifen treatment. Significance was compared with day 0 (n = 4 mice/group). Insert shows the negative correlation of serum HMGB1 level with that of hepatic HMGB1 (from B). (E) Liver/body weight ratio (LW/BW) and serum ALT level were determined after tamoxifen treatment (n = 3 mice/group). Only statistically significantly different data are labelled with the asterisk (compared with day 0). (F) Liver sections from Atg7Hep-ERT2 mice at different time points after induction were H&E stained. Original magnification, ×400. (G and H) The number of hepatic CK19+ (G) and A6+ (H) cells was quantified in Atg7Hep-ERT2 mice at different time points after induction (n = 3 mice/group). See also the images in Supplemental Figure 12, E–F. (I) The number of hepatic CK19+ or SOX9+ cells was quantified in the indicated mice on days 0 and 50 after induction (n = 3 mice/group). See also the images in Supplemental Figure 12G. Data represent the mean ± SEM. *P < 0.05, **P < 0.01, and ***P < 0.001, by 1-way ANOVA with Duncan’s post hoc analysis. D0, day 0; D5, day 5, etc.

