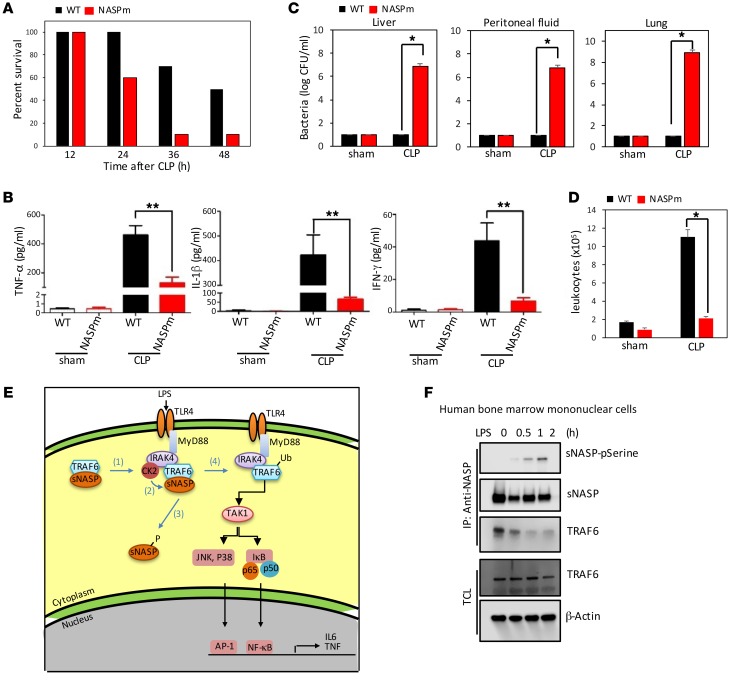
Figure 8. sNasp S158A-KI mice are more susceptible to sepsis due to defective immune response.
(A) Survival curves of WT and NASP S158A-KI (NASPm) mice following CLP (n = 10 per group per experiment). Bacterial load (as CFU) in the lung, liver, and peritoneal fluid (B), serum cytokines (C), and circulating leukocytes (CD11b+) (D) in WT and NASPm mice were measured 24 hours after sham treatment or CLP (n = 10 per group per experiment). (E) Model of TLR4 signaling regulated by sNASP. (1) Stimulation of TLR4 by LPS results in recruitment of IRAK4, CK2, and the TRAF6/sNASP complex. (2) CK2 phosphorylates sNASP. (3) p-sNASP is released from TRAF6. (4) TRAF6 autoubiquitination is followed by TAK-1 and IKK kinase activation and cytokine production. (F) IP with anti-NASP followed by IB with phosphorylated serine (pSerine), TRAF6, or NASP in human bone marrow mononuclear cells following LPS treatment. TCL IB was done with antibody against TRAF6 or β-actin. Results represent a minimum of 2 independent experiments with 10 mice each (A–D) or at least 3 (F) independent experiments. Data in B–D are mean ± SE for each group. *P < 0.05, **P < 0.01 (1-way ANOVA).

