
Figure 2.
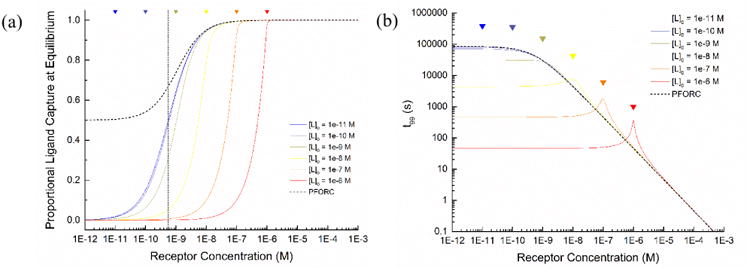
Comparison of analytical solution and PFORC model results. a) Ligand capture efficiency at equilibrium for the analytical and PFORC models. Curves represent the proportion of free ligand that is bound at equilibrium for varying initial concentrations of ligand and receptor. b) Calculated time required to achieve 99% of equilibrium binding in the analytical and PFORC models. All plots were generated using a KD of 5.5 × 10⁻¹⁰ M. Colored triangles denote the points where the receptor concentration is equivalent to the associated ligand concentration, to highlight the local changes near these values.