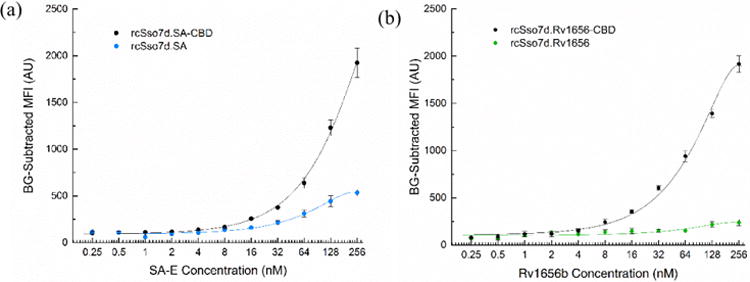
Figure 4.

Comparison of antigen titration curves for a) rcSso7d.SA/rcSso7d.SA-CBD and b) rcSso7d.Rv1656/rcSso7d.Rv1656-CBD. rcSso7d and rcSso7d-CBD species were contacted with their associated substrates (functionalized and non-functionalized cellulose, respectively) for standard incubation times at a soluble concentration of 20 μM. Sample sets were treated with a serial dilution of a) SA-E or b) Rv1656b, at concentrations ranging from 256 nM to 0.25 nM. Samples contacted with Rv1656b were subsequently contacted with SA-E at a concentration of 256 nM. Samples were imaged in the Texas Red channel using an exposure time of 1000 ms. Datasets were fit with a second-order polynomial (rcSso7d.SA: −0.008362x2 + 3.851x + 100.0, r2 = 0.9904; rcSso7d.SA-CBD: −0.01059x2 + 9.899x + 100.0, r2 = 0.9986; rcSso7d.Rv1656: −0.002774x2 + 1.229x + 100.0, r2 = 0.8271; rcSso7d.Rv1656-CBD: −0.02791x2 +14.16x + 100.0, r2 = 0.9961). The baseline for these datasets was adjusted to an arbitrary value of 100AU in order to enable the comparison of signal onset. Error bars represent the standard deviation of four independent replicates.
