
Figure 5.
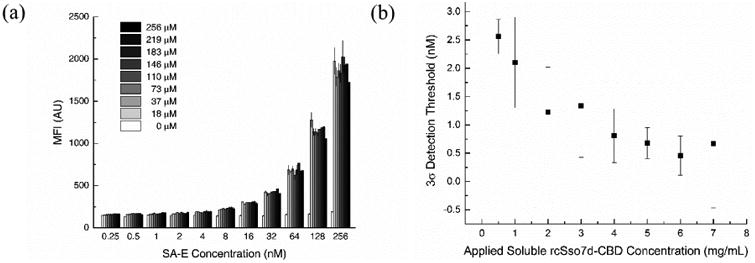
a) SA-E titration curves for various applied soluble concentrations of rcSso7d.SA-CBD. Sets of non-functionalized cellulose test zones were prepared with a range of soluble rcSso7d.SA-CBD concentrations. All test zones were contacted for 30s and washed, and were then treated for 30 minutes with a serial dilution of SA-E ranging from 256 nM to 0.25 nM. Samples were imaged in the Texas Red channel using an exposure time of 1000 ms. Datasets were fit with a second-order polynomial. Error bars represent the standard deviation of four independent replicates. b) Limits of detection for various applied concentrations of rcSso7d.SA-CBD. The measured MFI values for all negative control samples (with [SA-E] ranging from 256 nM to 0.25 nM) were averaged to calculate a conservative three-sigma detection threshold of 167.8 AU. Second-order polynomial lines of best fit were used to calculate the antigen concentration corresponding to this LOD for each sample set treated with a different applied rcSso7d.SA-CBD concentration. Second-order polynomial lines of best fit were also used to plot the upper and lower bounds of each data point (determined by the standard deviation), and these bounding trendlines were used to generate bounds on the limits of detection, represented by the error bars.