Figure 5.
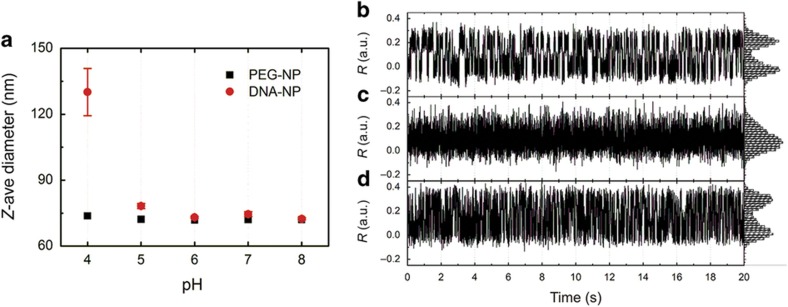
Modulation of C-rich DNA-NP interactions via pH. (a) Z-average diameter of DNA-NPs and PEG-NP controls in the pH range of 4–8 as determined by DLS. (b–d) R trajectories of an individual NP-liposome, which contained two DNA-NPs in an ambient medium of (b) pH=8, (c) pH=4, and (d) pH=8 again. Histograms of the R values are included on the y axis to illustrate the probability distribution of the R values. The R fluctuations exhibit a reversible pH-sensitive behavior. Both pH=8 measurements show a bimodal distribution with well separated high and low R value peaks, but the pH=4 histogram shows a single dominant peak at the lower end of the R value range. DLS, dynamic light scattering; DNA-NP, DNA-functionalized NP; PEG-NP, polyethylene glycol-functionalized NP.

