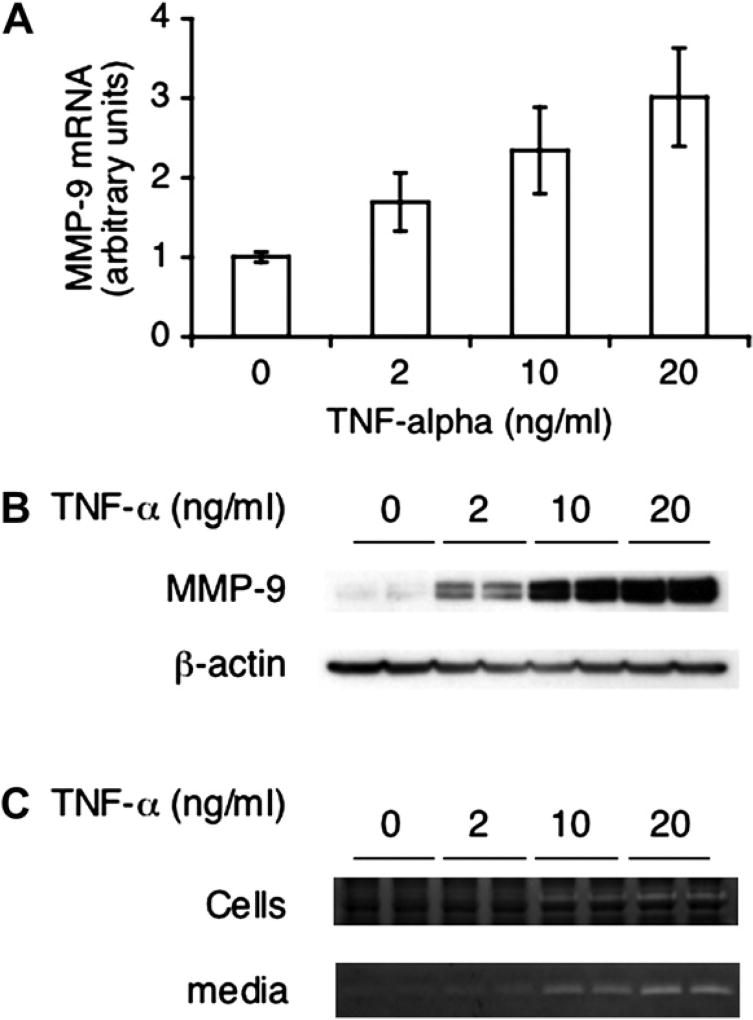
Figure 2.
TNF-α–induced MMP-9 expression in macrophages. Macrophages isolated from WT mice as described in Materials and Methods were treated with TNF-α for 2 hours (A) or 24 hours (B, C) at different doses and subjected to quantitative reverse transcription polymerase chain reaction (A), Western blotting (B), and gelatin zymography (C). Data in (A) were pulled from three experiments and normalized to 18S rRNA. MMP-9 RNA in control group was used as the reference in relative quantification. Data shown are averages ± standard deviation (n = 3). Shown in (B) is a representative blot from three experiments. The membrane was reprobed with anti–β-actin as loading control. Shown in (C) are the representative gelatin zymograms from the cell lysates and the media from three experiments.

