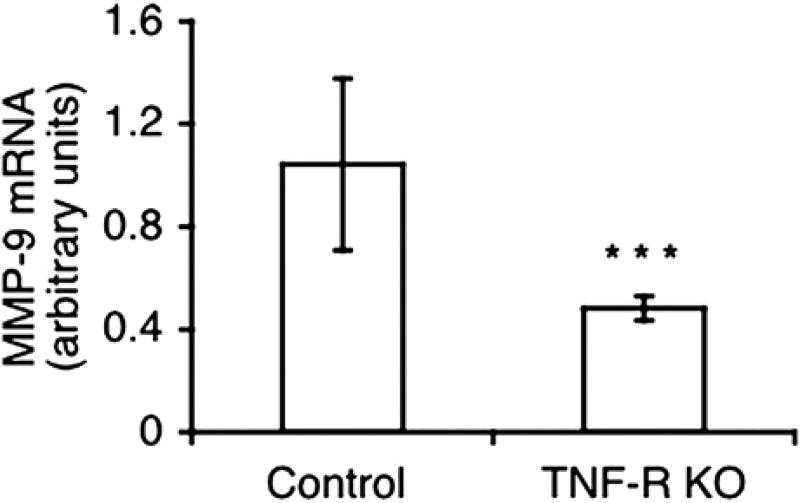
Figure 3.
MMP-9 levels in macrophages from TNF-α receptor KO mice. Quantitative reverse transcription polymerase chain reaction analysis of MMP-9 mRNA levels, normalized to 18S rRNA, in macrophages from TNF-α receptor KO and its WT control mice. MMP-9 RNA in WT control group was used as the reference in relative quantification. Data shown are averages ± standard deviation (n = 3). ***p < 0.001 for WT control cells as compared to TNF-α receptor KO cells.

