Fig. 5.
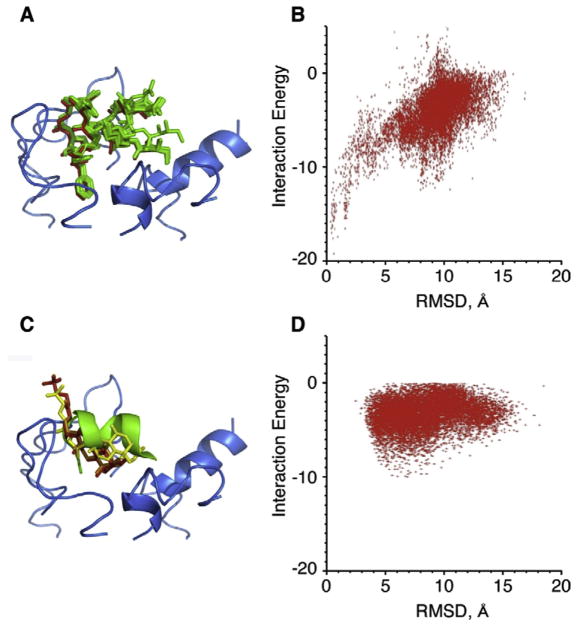
Computer docking of native Gtα(340–350) and TUDCA to the model of the intracellular loops of R*. A. Ten lowest energy conformations of Gtα(340–350) are green stick models docked to the intracellular loops of R* (blue ribbon). The original model pose of Gtα(340–350) is in red. B. The energy funnel that resulted from the docking calculations showing convergence on the model of the complex. C. TUDCA shown as stick models docked onto the model of R* loops (blue ribbon). The best scoring solution that docked along the helical axis of Gtα(340–350) is shown in red, the second best in orange and the third best in yellow. The model of Gtα(340–350) is shown as green ribbon. D. The plot of interaction energy vs RMSD from the starting structure. (For interpretation of the references to colour in this figure legend, the reader is referred to the Web version of this article.)

