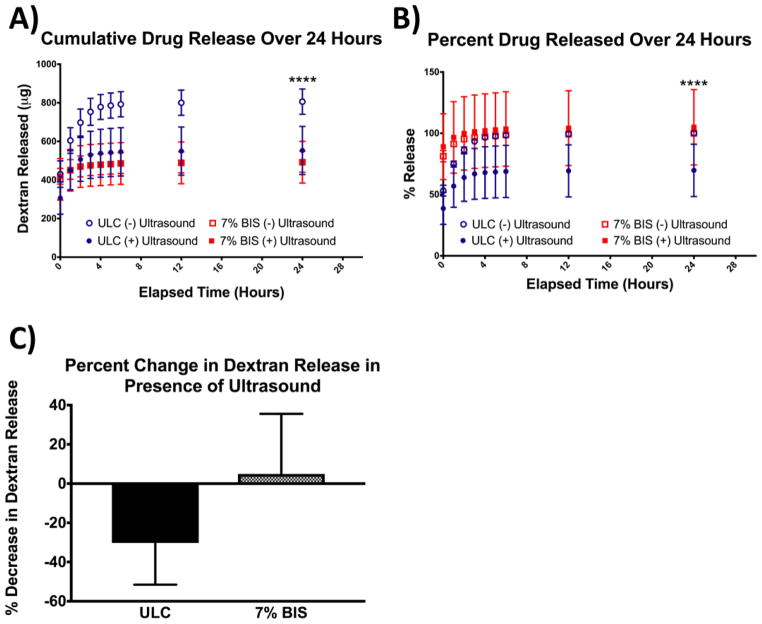
Figure 9.
(a) Cumulative release of 20 kDa dextran from ULC and 7% BIS microgels in the presence or absence of ultrasound. (b) Percent dextran released from ULC and 7% BIS microgels in the presence or absence of ultrasound, normalized to maximum release from each microgel type in the absence of ultrasound. (c) Percent change in cumulative dextran release after 24 hours from each microgel type in the presence of ultrasound. Error bars represent standard deviation from the mean.

