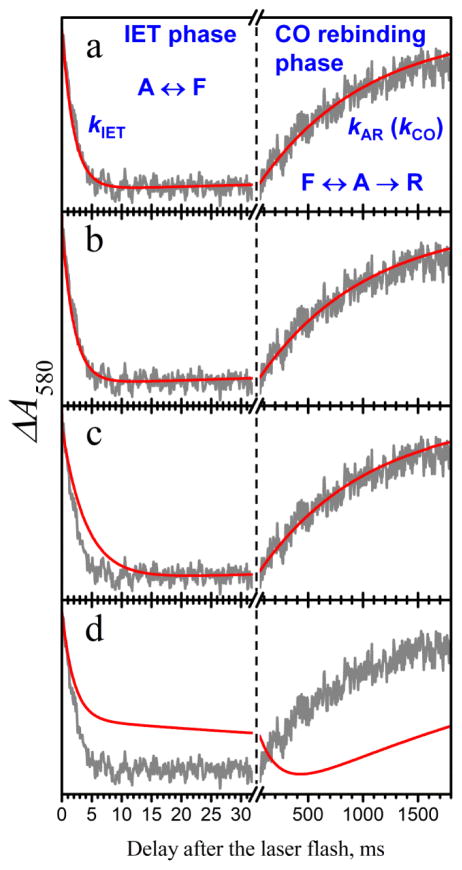
Figure 2.
Examples of LFP experimental and simulated traces. Gray trace in all panels, experimental LFP trace at I = 200 mM. Red traces are simulated for the following parameters: panel a, (kUD, kET) = (100, 3.16) ms−1; panel b, (kUD, kET) = (0.505,100) ms−1; panel c, (kUD, kET) = (0.25, 100) ms−1; panel d, (kUD, kET) = (0.001,0.5) ms−1. The following simulation parameters were similar for all panels: Pd = 0.16, kETf/kETb = 3.1, kAR = 4.25 s−1. The kDU values derived from the abovementioned kUD and Pd are 525 ms−1, 2.65 ms−1, 1.32 ms−1, and 5.25 s−1 for panels a, b, c, and d, respectively. The annotations in panel a show the assignment of the distinct phases of the LFP trace to the IET and CO rebinding processes and to the transitions between the R, A, and F-states shown in Figure 1. Note that in panel d the IET stage actually partly extends to the right-hand side of the Figure.

