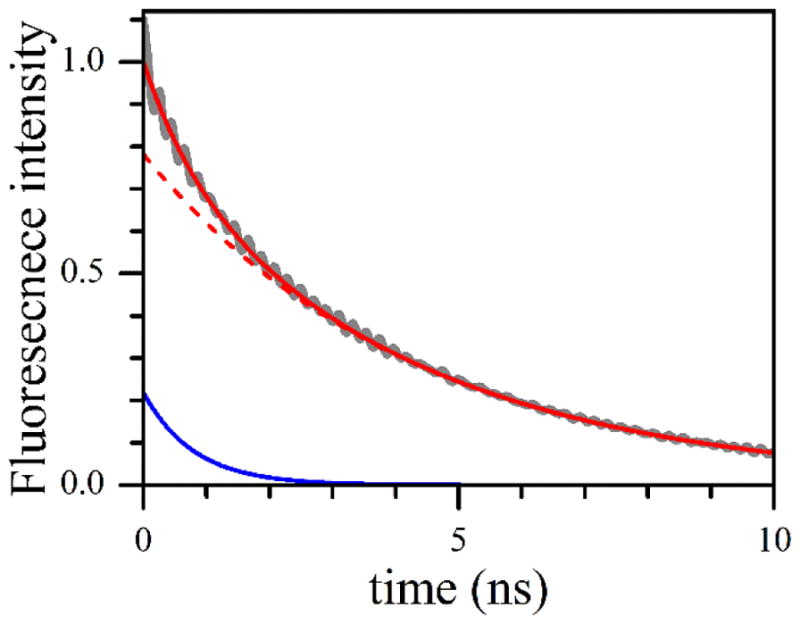
Figure 3.

Gray trace, the experimental transient FMN fluorescence trace obtained by the deconvolution of the raw experimental trace and the instrument response function (see the SI for details). The experimental trace corresponds to I = 100 mM. Solid red line, the least squares fit using two exponential functions. The constituent exponents are shown by the red dashed line (amplitude = 0.78; decay time = 4.3 ns) and solid blue line (amplitude = 0.22; decay time = 0.8 ns). The small-amplitude 6 GHz oscillation in the experimental trace is the result of data processing (see the SI).
