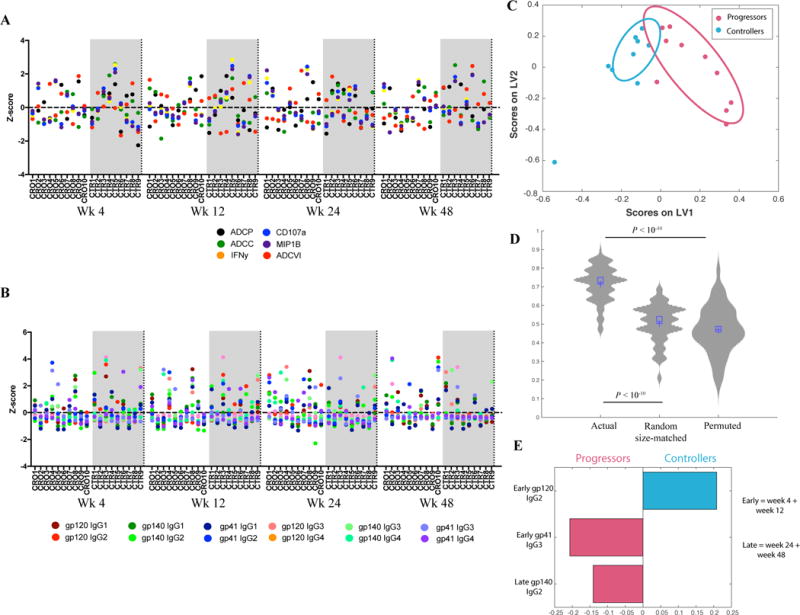
Figure 1. Changes in HIV-specific IgG subclasses between early and late acute infection effectively and rigorously differentiate between progressors and controllers.

A – The confetti plot depicts the Ab effector functions (Z-scores) in progressors (CROs) and controllers (CTRs).
B – The confetti plot depicts gp120-, gp140- and gp41-specific IgG subclass levels (Z-scores) in progressors (CROs) and controllers (CTRs).
C – The LASSO/PLS model illustrates separation between progressors and controller Ab profiles. Ellipses correspond to estimated 75% confidence intervals.
D – The violin plots compare classification accuracy for the LASSO/PLS model for separating progressors and controllers, from 100 rounds of 5-fold cross-validation using actual, permuted and randomly selected (size-matched) features. Significance was measured using a U/Wilcoxon ranked test.
E – The Variable Importance in the Projection (VIP) plot corresponding to the LASSO/PLS model illustrates the relative importance (longer bar = more important) of the selected features. Colors correspond to the group (progressors/controllers) the feature is higher in.
