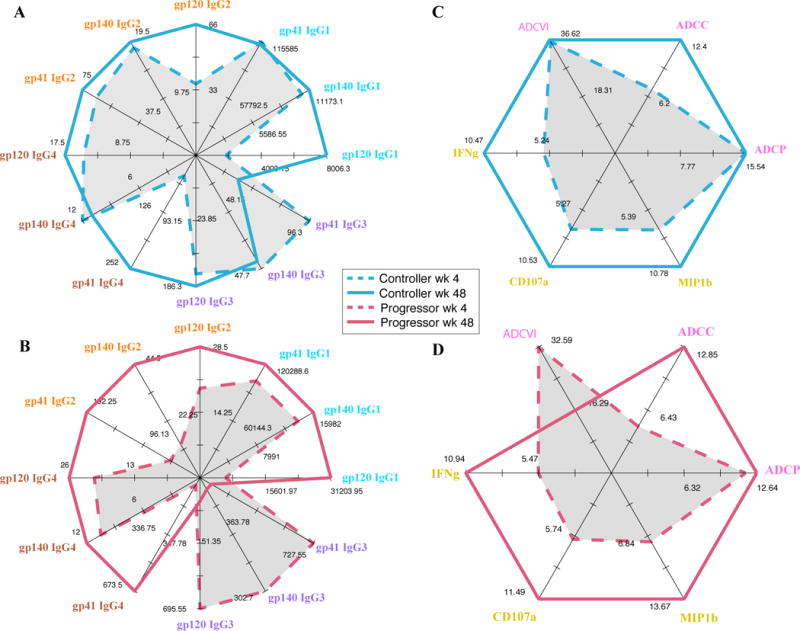
Figure 2. Progressors lose HIV-specific IgG3 Abs and gain HIV-specific IgG2 Abs during acute infection.

A – The radar plot illustrates antigen-specific IgG subclass levels in controllers at weeks 4 (dotted line) and 48 (solid line) respectively.
B – The radar plot illustrates antigen-specific IgG subclass levels in progressors at weeks 4 (dotted line) and 48 (solid line) respectively.
C – The radar plot illustrates different Ab-dependent effector functions in controllers at weeks 4 (dotted line) and 48 (solid line) respectively.
D – The radar plot illustrates different Ab-dependent effector functions in progressors at weeks 4 (dotted line) and 48 (solid line) respectively.
For all radar plots, each axis is on a scale corresponding to the IgG subclass level/function under consideration. The outermost point corresponds to the highest value of the feature being plotted along that axis.
