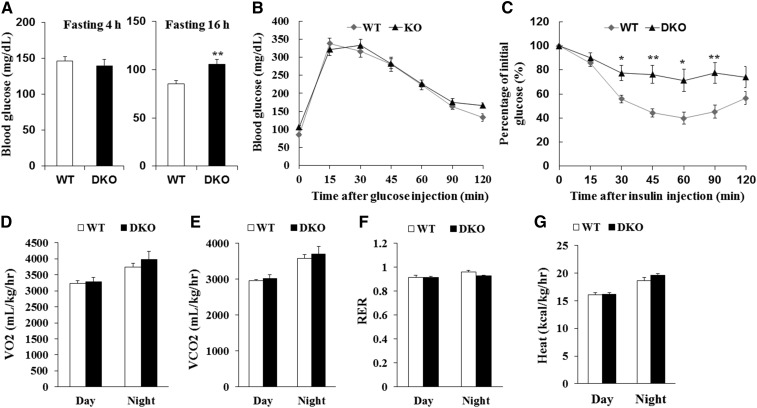
Fig. 2.
Induced insulin resistance in DKO mice. A: Fasting glucose levels (n = 9). B, C: Blood glucose concentrations during intraperitoneal GTTs (B) (n = 9) and intraperitoneal ITTs (C) (WT, n = 8; DKO, n = 9) performed on WT and KO mice. D–G: Average VO2 (D), VCO2 (E), RER (F), and heat production (G) performed on WT and DKO mice (n = 5). Comparisons were made by unpaired two-tailed Student’s t-tests. Error bars represent SEM. *P < 0.05, **P < 0.01.

