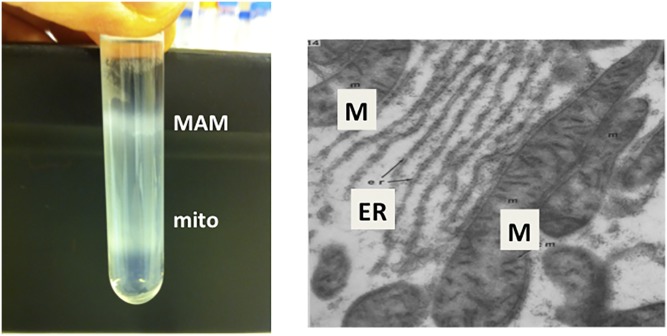
Fig. 6.
MAMs. Left: Percoll gradient isolation of MAMs and mitochondria from rat liver (from the author’s personal file). Right: Electron microscopic visualization of MAMs, shown as contacts/close proximity between ER and mitochondria (M) [From (95)].

