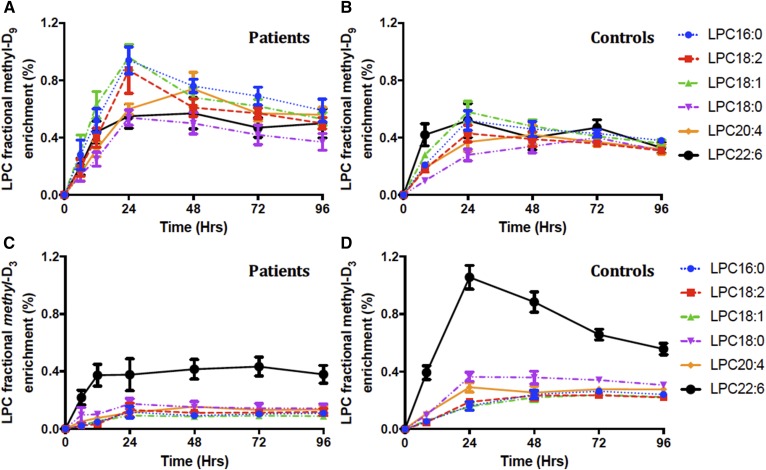
Fig. 10.
Molecular specificity of fractional methyl-D9-LPC (A, B) and methyl-D3-LPC (C, D) enrichment for individual LPC species. Results are presented as the labeled fraction in the total plasma LPC pool for that individual PC species, compared between patient and control groups over the investigative period of 4 days. Each line color represents individual LPC species; blue, LPC16:0; red, LPC18:2; green, LPC18:1; purple, LPC18:0; yellow, LPC20:4; and black, LPC22:6. Data are expressed as mean ± SEM.

