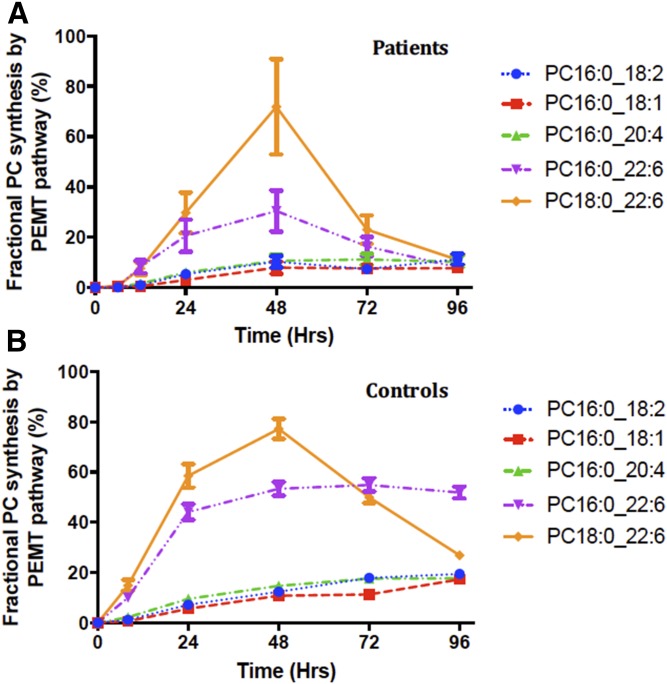
Fig. 8.
Molecular specificity of PC fractional synthesis via the PEMT pathway. This was estimated by using methyl-D3-SAMe corrected for the corresponding methyl-D3-PC enrichment for the particular PC species of interest. Among the selected PC species, PC16:0_22:6 followed by PC16:0_22:6 were the major PC species synthesized by this pathway. Each colored line represents individual molecular PC species: blue, PC16:0_18:2; red, PC16:0_18:1; green, PC16:0_20:4; purple, PC16:0_22:6; and yellow, PC18:0_22:6. Data are expressed as mean ± SEM.

