Fig. 1.
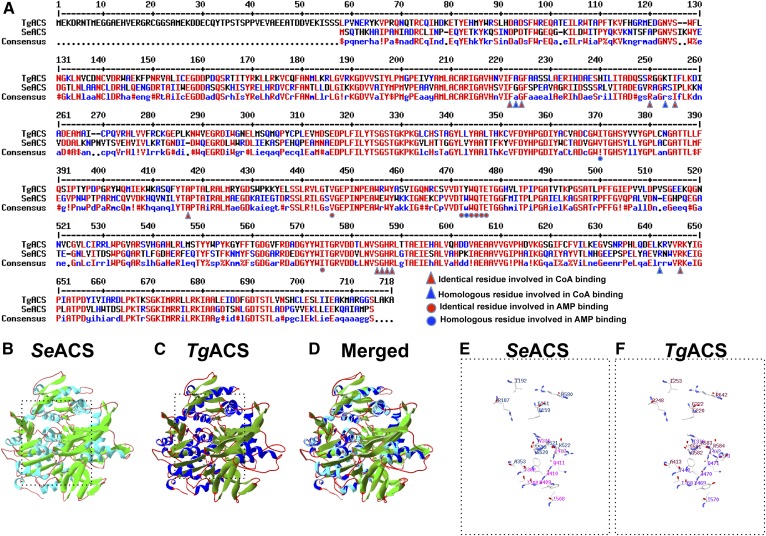
Structural analysis of the predicted TgACS. A: Alignment of protein sequences from TgACS and ScACS. High consensus or identity in the residues are shown in red and lower consensus is shown in blue, while black depicts neutrality. Amino acid residues for the CoA binding are depicted by red triangles, homologous residues for the CoA binding are shown with blue triangles, identical residues involved in AMP binding are shown by red circles, and homologous residues for AMP binding are shown with blue circles. B: Crystal structure of SeACS. C: Predicted model of TgACS based on SeACS crystal structure. D: Overlay of the SeACS crystal structure and the homology model of TgACS. The overall structure of TgACS is conserved and highly similar as observed in the ribbon representation. E: A 3D representation of the amino acid residues involved in AMP and CoA in SeACS. F: A 3D representation of the predicted residues involved in AMP and CoA binding in TgACS.

