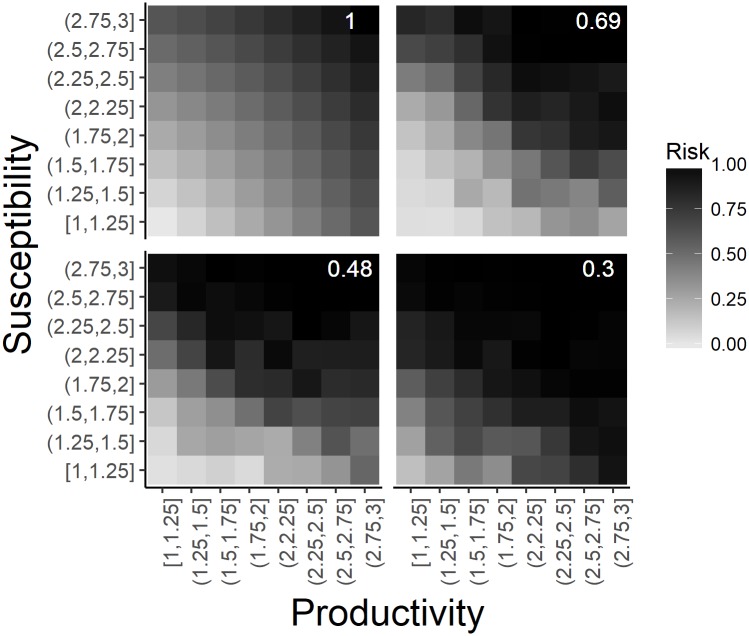
Fig 3. The assumed and observed relationship between productivity and susceptibility scores and risk.
The relationship between the productivity and susceptibility scores and risk assumed by the PSA (top left) and the observed patterns for the analysis with the highest similarity score (top right; additive ePSA with low exploitation rate and B < 0.2B0 reference point), mean similarity score (bottom left; multiplicative sPSA with low initial stock size, high exploitation rate and B < 0.1B0 reference point) and the lowest similarity score (bottom right; multiplicative sPSA with high initial stock size, high exploitation rate and B < 0.2B0 reference point). Risk in each plot has been standardized to a minimum and maximum value of 0 and 1 and the similarity score is shown in white text in the top right corner of each plot.

