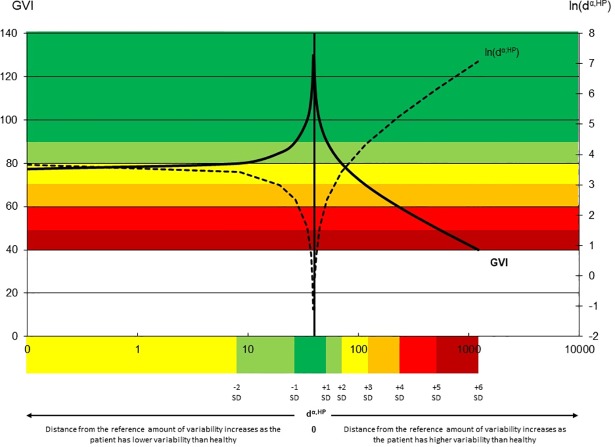
Fig 1. Representation of the values for the original GVI (left axis) and the raw GVI, i.e. = ln(d⍺,HP) (right axis), in function of the distance d⍺,HP between the patient and the reference population (horizontal axis, logarithm scale).
A zero distance from the HP is represented by the vertical line. The more the distance increases the more the raw GVI increases leading to a decreasing GVI score. Towards left when the patient is less variable than HP, towards right when the patient is more variable. The colors in the horizontal axis show the limits for 1 standard deviation separating the patient and the HP. The colors in the graphic show the GVI obtained for these ranges. This figure illustrates both the magnitude problem and the possibility to get a same GVI with higher and lower variability than HP.

