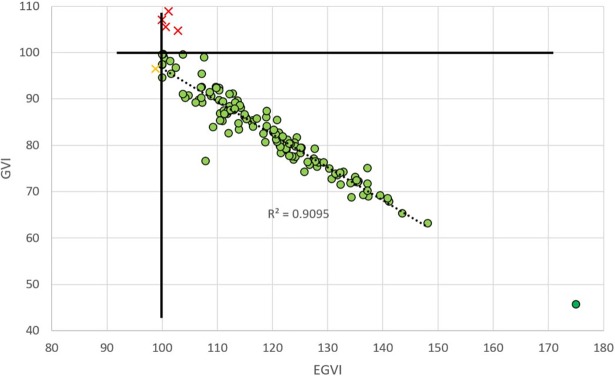
Fig 3. Relationships between GVI (vertical axis) and EGVI, in the data from Gouelle et al. (2015).
The point in dark green represents the younger child who walked independently only for two weeks and is provided to give an idea about what could be about the ceiling of EGVI (175) for a high level of unsteadiness in ambulation.

