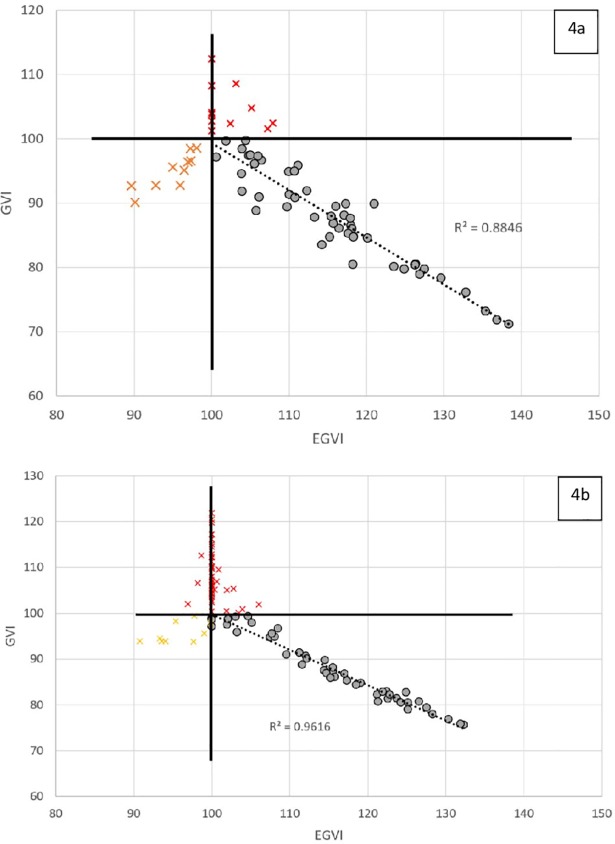
Fig 4.
Relationships between GVI (vertical axis) and EGVI, in the data from Balasubramanian et al. (2016) (4a) and in the data from Rennie et al. (2017) (4b). The coefficient of determination was computed once all data represented by crosses were removed. The crosses in the area where GVI<100 and EGVI<100 correspond to data for which the lower GVI was due to lower variability than HP. The crosses for GVI>100 are from individuals whose distance d⍺,HP was smaller than mean HP.

