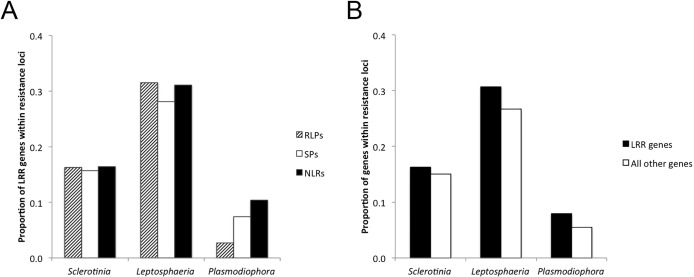
Fig 4. Proportions of Brassica napus genes encoding receptor-like proteins (RLPs), secreted peptides (SPs) or nucleotide-binding leucine-rich repeat receptors (NLRs) within chromosomal intervals (loci) for resistance against Sclerotinia sclerotiorum (necrotroph), Leptosphaeria maculans (extracellular) or Plasmodiophora brassicae (intracellular).
(A) Proportions represent the numbers of RLP, SP or NLR genes within the mapped regions for resistance against S. sclerotiorum, L. maculans or P. brassicae divided by the total number of genes for each of the three families. Contingency tests show that proportions of RLP, SP and NLR genes are not equal for resistance against P. brassicae (χ2 = 9.84, P = 0.007). (B) Proportions represent the total number of LRR genes (RLP, SP and NLR) within mapped regions for resistance divided by the total number of LRR genes (black bars). These proportions were compared to those for all of the genes within mapped regions for resistance divided by the total number of genes within the genome (white bars). Differences between these two proportions were not significant (contingency table, χ2 = 1.90, P = 0.39).

