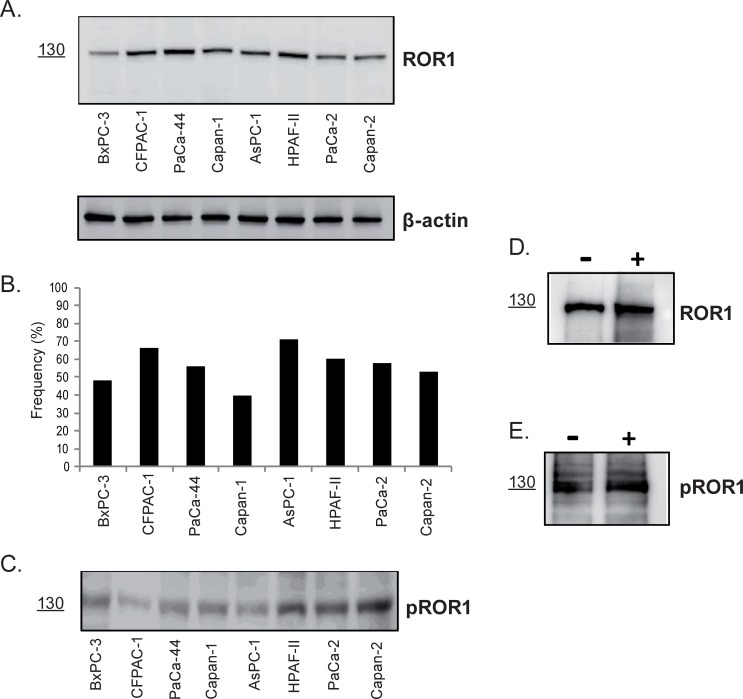
Fig 1. Expression of ROR1 in 8 human pancreatic cancer cell lines.
(A) ROR1 expression by Western blot (The fully glycosylated ROR1 protein is 130 kDa) [11]. β-actin was used as loading control. (B) Frequency (mean±SEM) (%) of surface ROR1+ cells (flow cytometry). [Statistically significant difference (p-values≤0.01) were: BxPC-3 vs AsPC-1 <0.01; CFPAC-1 vs Capan-1 <0.01; Capan-1 vs AsPC-1 <0.01; AsPC-1 vs Capan-2 = 0.01]. (C) Expression of phosphorylated ROR1 protein (pROR1) (130 kDa). ROR1 and pROR1 expression in surface ROR1 positive (+) and negative (-) PaCa-2 cells (cell sorting). (D) A 130 kDa ROR1 protein was detected (Western blot) in both the ROR1+ and ROR1- fractions. (E) ROR1+ and ROR1- fractions expressed a pROR1 protein (130 kDa).

