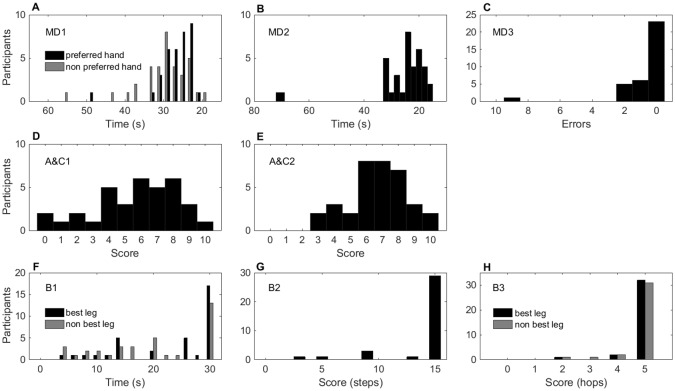
Fig 1. Distribution of the scores of the eight MABC-2 items, pilot study (n = 35).
The y-axis shows the number of participants achieving a given raw score (x-axis). Panels A-C, manual dexterity; D-E, aiming and catching; F-H, balance items. Good performance is represented on the right, and poor performance on the left of each x-axis. Ceiling effects are seen in a greater proportion of the distribution on the right of each histogram (e.g., panel G). Items where both hands (or legs) were scored are shown in the same panel, with the preferred or best limb in black and the non-preferred or other limb in grey.

