
Fig 2. Fold change in total FAA, EAA and NEAA of pepper leaves after different treatments (high aphid density, low aphid density, and water stress).
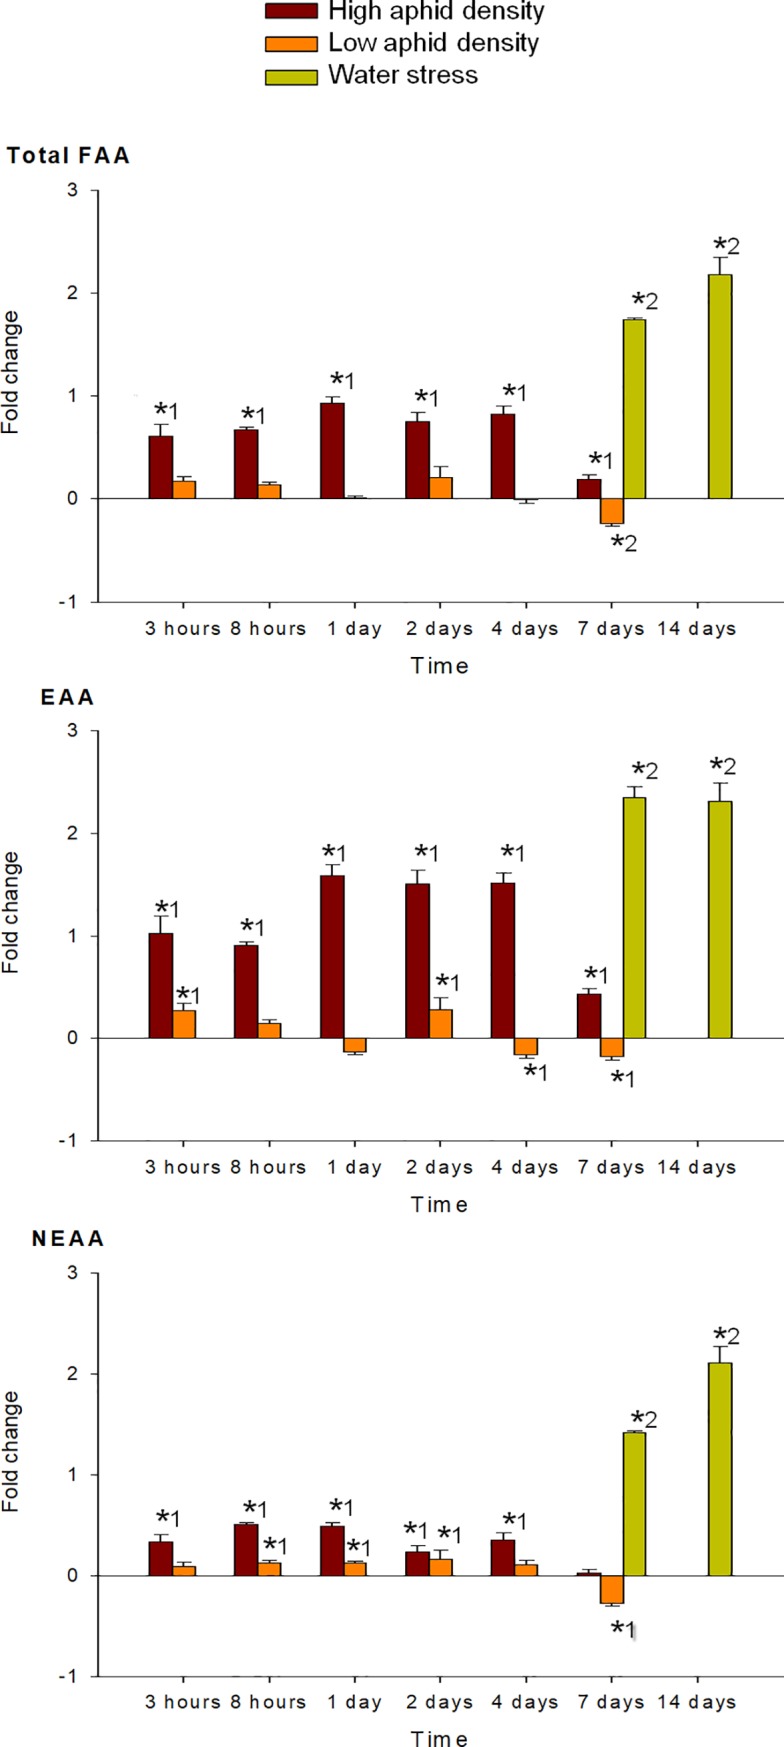
Mean +/- s.d. of n = 4. Positive or negative values indicate increases or decreases, respectively. Asterisks indicate significant changes (P-value < 0.05) in Tukey1 or Games-Howell2 post hoc analysis relative to their respective control leaves.