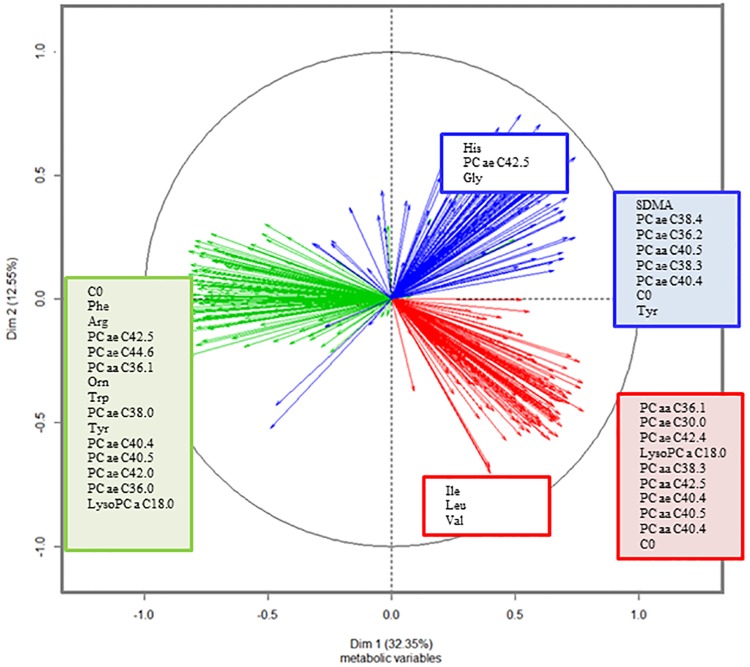
Fig 1. Correlation circle of metabolites in each increment of time in the first and second principal components: In red, metabolites correlated with T1–T0, in green, metabolites correlated with T3–T1, and in blue, metabolites correlated with T6–T3.
Up to the most correlated 15 metabolites (correlation higher than 0.7 or smaller than -0.7) to each PC are shown. Metabolites correlated with the first dimension are written in the filled squares and those metabolites correlated with the second dimension are written in the white squares. Variables were adjusted by age and gender. The profiles of PC aa and PC ae and carnitine were also linked to T6–T3 in PC1. Carnitine negatively correlated with PC1 in the increment T3–T1 (r = -0.88, p<0.001). Changes in lysoPC a C18:0 inversely correlated with T1–T0 in PC1 (r = 0.77, p<0.001) and changes in T3–T1 in PC1 (r = -0.82, p<0.05). The increment T3–T1 correlated with a large profile of amino acids and certain PC aa and PC ae in PC1 (r<-0.85, p<0.05). Changes in tyrosine and PC ae C42:5 were kept in T6–T3 (r = 0.71 with PC2, p<0.01). Histidine and glycine correlated with the last time period (r>0.70 with PC2, p<0.001). Hence, T1–T0 was explained by changes in branched-chain amino acids (BCAAs, isoleucine, leucine and valine) (r<-0.7 with PC2, p<0.001) and PC ae and PC aa (r>0.7 with PC1, p<0.001).

