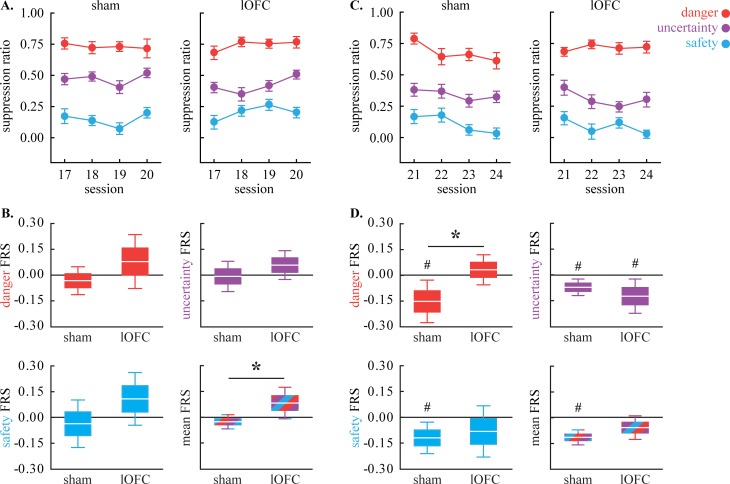
Fig 3. Fear regulation.
(A) Mean ± SEM suppression ratio for danger (red), uncertainty (purple) and safety (blue) are shown for sham (left) and lOFC rats (right) for the four sessions in which the uncertainty foot shock probability was increased. (B) Mean ± 2 SEM (1 SEM box; 2 SEM whisker) fear regulation score (FRS) is shown for danger (top left), uncertainty (top right), safety (bottom left) and mean of all cues (bottom right); sham (left) and lOFC (right). (C-D) LOFC data plotted as in A-B. *independent samples, two-tailed t-test, p<0.05. #single sample comparison to zero, two-tailed t-test, p<0.05.

