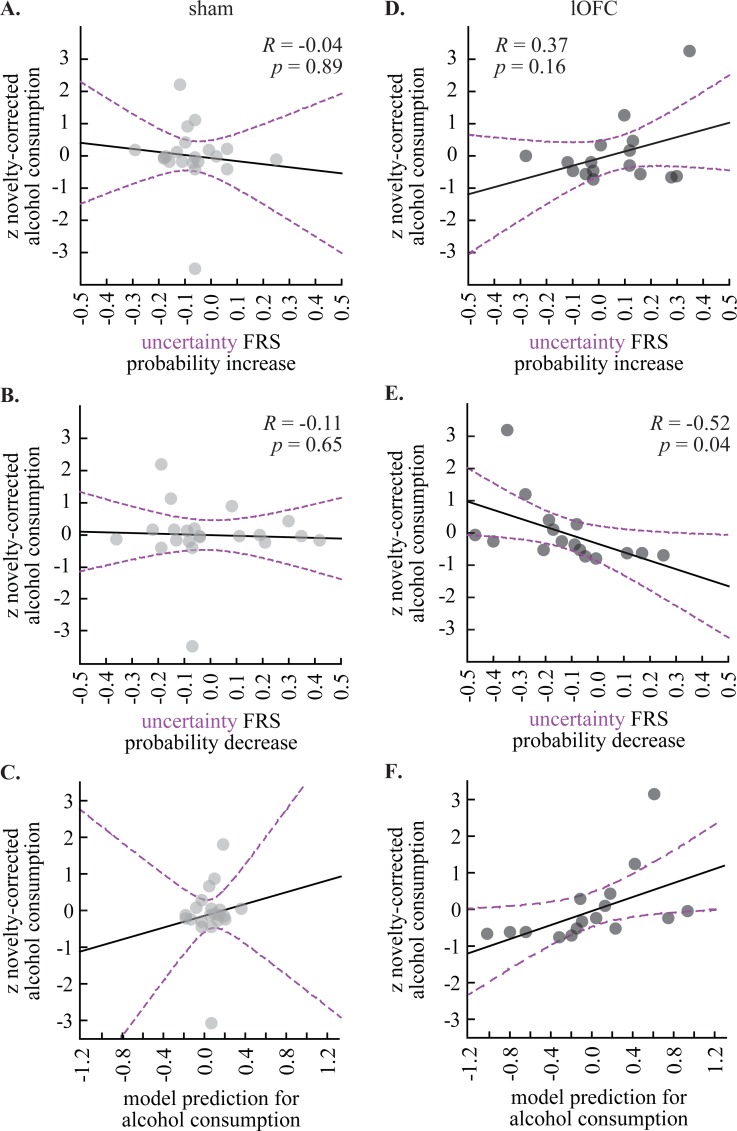
Fig 5. Relationship between fear regulation and voluntary alcohol consumption.
Scatterplots show the (A) correlation between uncertainty FRS for shock probability decrease (x-axis) and the z-score for novelty-corrected alcohol consumption (y-axis) and (B) correlation between uncertainty FRS for shock probability increase (x-axis) and the z-score for novelty-corrected alcohol consumption (y-axis) for shams. Correlation coefficient (R) and significance (p) are indicated for each plot. (C) Regression model prediction for alcohol consumption (data from A and B) is compared to observed alcohol consumption for shams. Trendline (solid black) and 95% confidence interval (dashed purple) are plotted for each scatterplot. (D-F) LOFC data plotted as in A-C.

