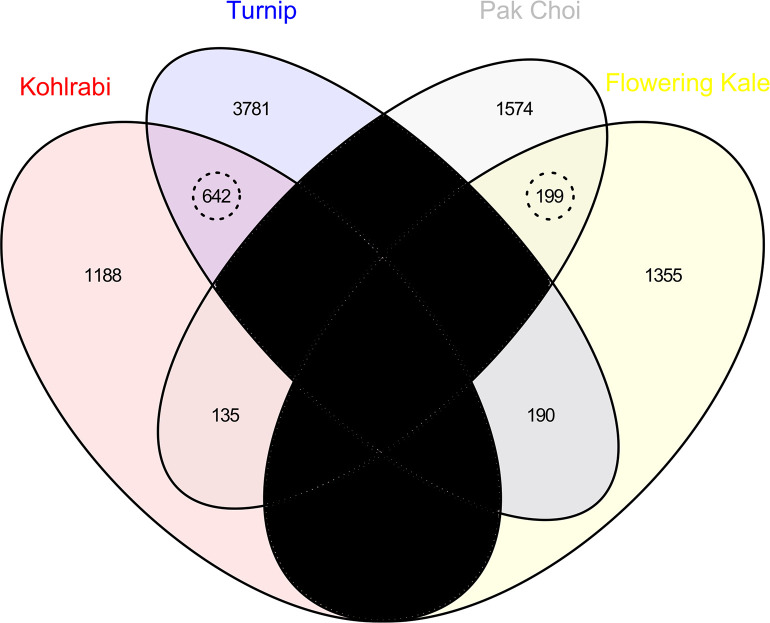
Fig 8. Venn diagram illustrating the number of gene loci with statistically increased expression levels (q-value < 0.05).
Two comparisons are illustrated (kohlrabi : flowering kale and turnip : pak choi. There are 642 gene loci with increased expression in both kohlrabi and turnip compared to flowering kale and pak choi, respectively, and 199 gene loci with increased expression in both pak choi and flowering kale compared to kohlrabi and turnip, respectively. Thus, there are 841 core genes that share similar patterns of differential expression. Regions in black are not applicable, as a gene cannot have increased expression in both kohlrabi and flowering kale or in both turnip and pak choi due to the selected comparisons.

