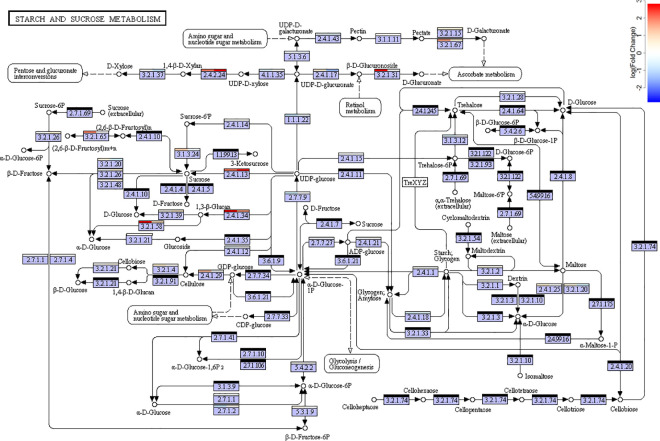
Fig 10. KEGG map of starch and sucrose biosynthesis pathway (map0500).
Bars above each enzyme label indicate the average log fold expression change in the corresponding gene transcripts in turnips : pak choi (left) and kohlrabi : flowering kale (right). Black bars indicate enzymes whose corresponding mRNA expression was not detected in the exome data set. S4–S6 Figs provide similar illustrations of other KEGG pathways.

