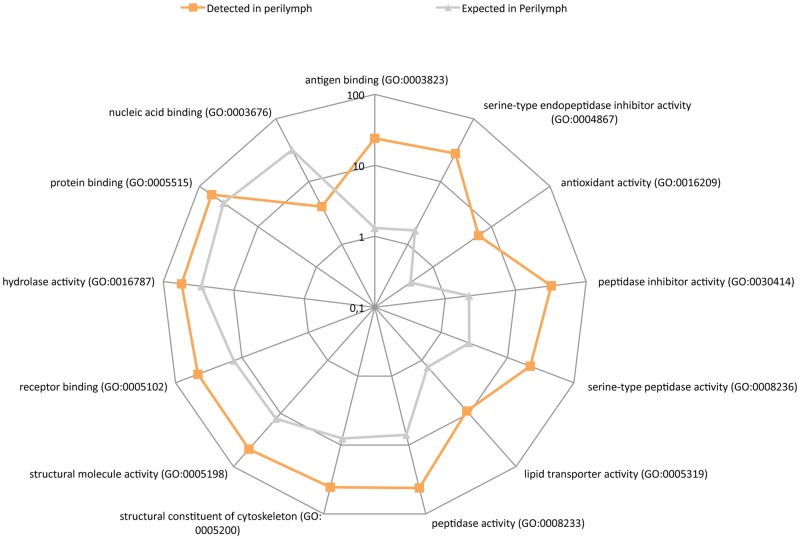
Fig 4. PANTHER overrepresentation test of molecular function.
Radar diagram, with a logarithmic scale, showing a comparison between the numbers of expected and detected proteins in each molecular function group. Orange boxes represent the detected number while gray triangles show the expected number. In total, 12 enriched molecular functions and one down-regulated.

