Fig. 6.
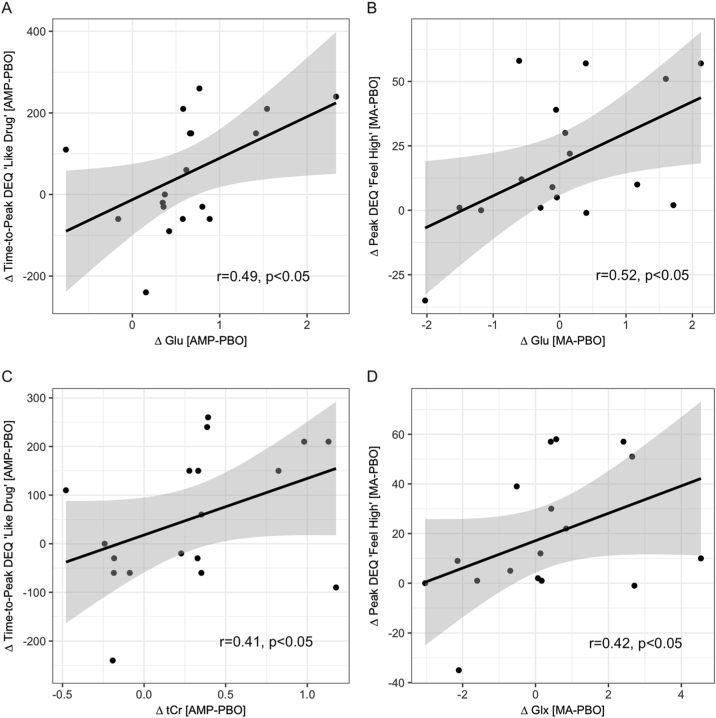
Mood correlates. a AMP change in Glu (Δ Glu) is positively correlated with the duration of peak DEQ “Like Drug” responses to AMP (Δ Time-to-Peak DEQ “Like Drug”), r = +.49, p = .02. b AMP change in tCr (Δ tCr) is positively correlated with the duration of peak DEQ “Like Drug” responses to AMP (Δ Time-to-Peak DEQ “Like Drug”), r = +.41, p = .047. c MA change in Glu (Δ Glu) is positively correlated with peak DEQ “Feel High” responses to MA (Δ Peak DEQ “Feel High”), r = +.52, p = .016. d MA change in Glx (Δ Glx) is positively correlated with peak DEQ “Feel High” responses to MA (Δ Peak DEQ “Feel High”), r = +.42, p = .049. Glx glutamate, tCr total creatine, Glx glutamate and glutamine. All metabolites were corrected for partial volume effects, see Materials and methods. Details on Δ Glu, Glx, tCr, DEQ “Like Drug,” and DEQ “Feel High” ratings are in Suppl. Methods. Gray shading is 95% confidence interval. n = 17–18 participants with full data for analysis, see Suppl. Methods for details

