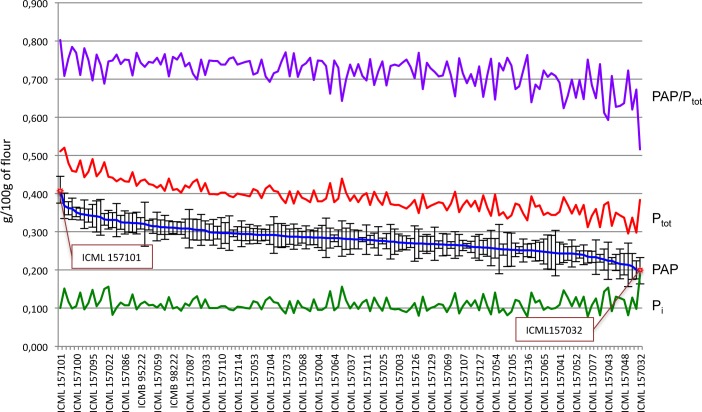
Fig 1. Distribution of phytate and total phosphate among 145 pearl millet lines from a panel of inbred lines covering a large genetic diversity.
Phytic acid phosphorus (PAP, blue line), total phosphorus (Ptot, red line), ratio of phytic acid content to total phosphorus (PAP/Ptot,, violet line) and Pi (green line). Red dots and boxes indicate the most contrasting lines for phytic acid content.

