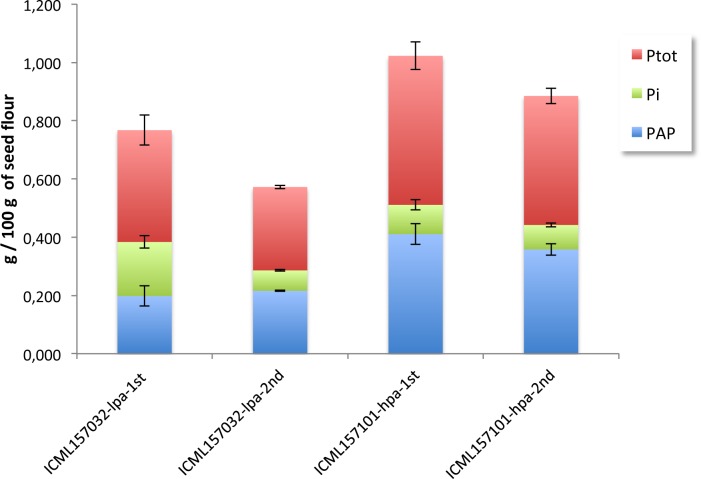
Fig 2. Distribution of phytic acid content, total phosphorus and inorganic phosphate in the grains of the first and second generations of inbred lines contrasting for phytic acid and total C-GFs content.
ICML157032, lpa and hcgf and ICML157101, hpa and lcgf. Each data is the mean of two biological replicates.

