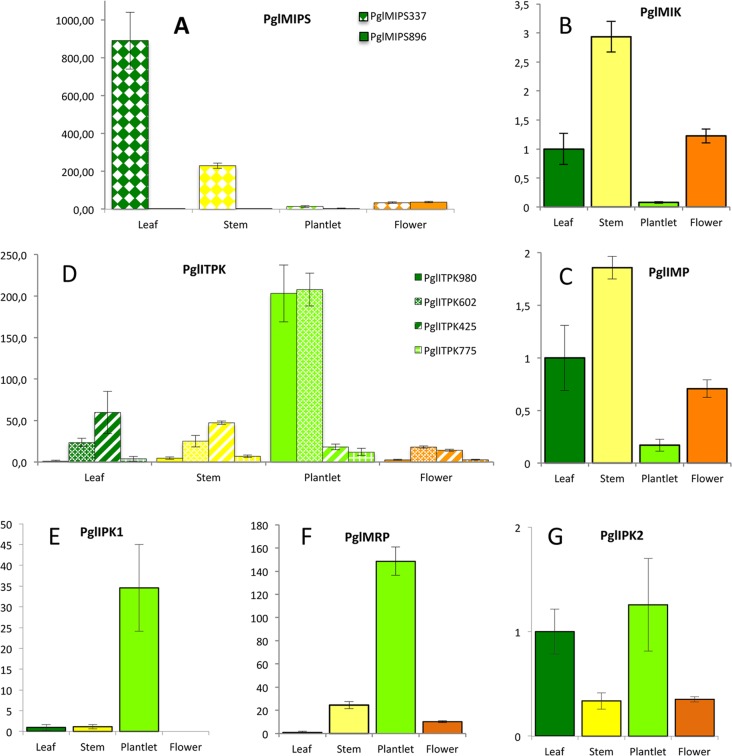
Fig 12. Expression analysis by quantitative RT-PCR of genes involved in phytic acid pathway in leaves, stems, plantlets and anthesis flowers of the reference line SDEB4L-160P6.
Color of the bars indicate different organs: dark green, leaf; yellow, stem; light green, plantlet; orange, flower. (A) expression of PglMIPS_337 and PglMIPS_896; (B) expression of PglMIK; (C) expression of PglIMP; (D) expression of PglITPK_980, PglITPK_602, PglITPK_425 and PglITPK_775; (E) expression of PglIPK1; (F) expression of PglMRP; (G) expression of PglIPK2. Leaf samples were used as calibrators.

